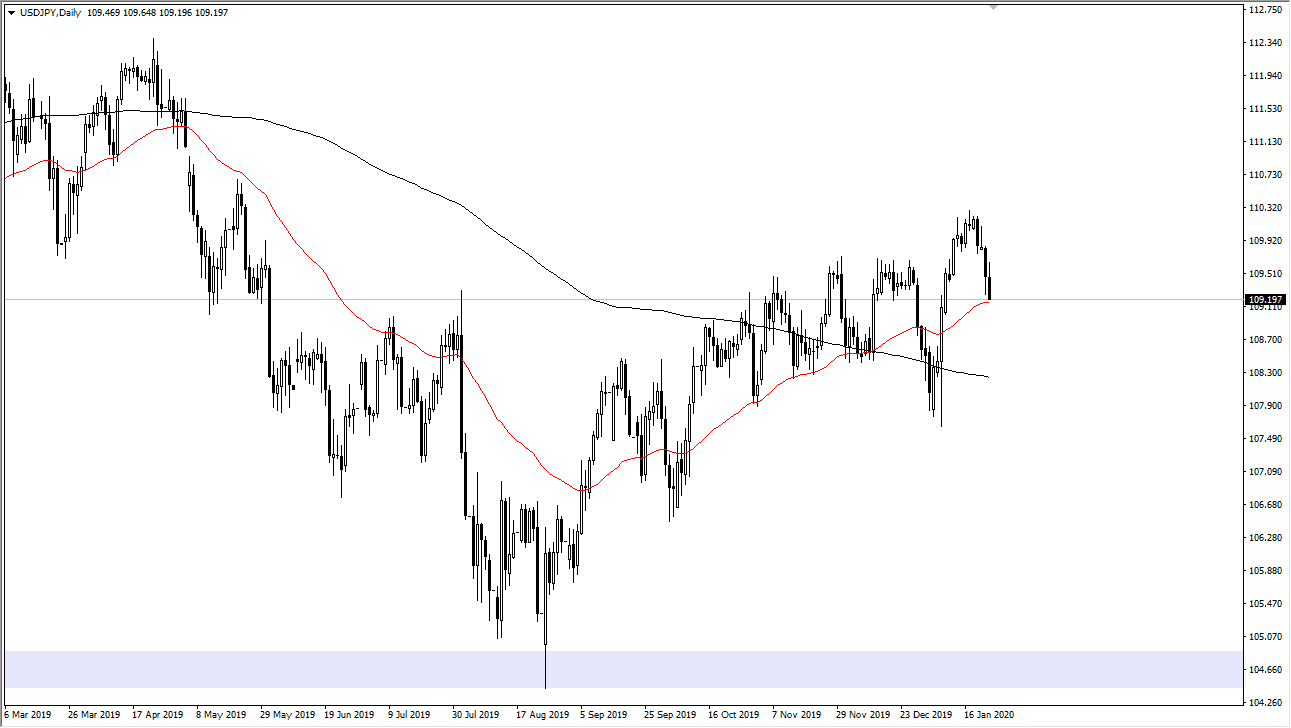
The US dollar has initially tried to rally during the trading session on Friday but then turned around to reach towards the 50 day EMA, which of course is a crucial technical indicator. Furthermore, the ¥109 level is one that should be paid attention to, as it is a large, round, psychologically significant figure and of course an area where we have seen resistance at.
By breaking below the 50 day EMA, the market is likely to go down towards the 200 day EMA, which is near the ¥108.30 level. Any pullback to that area should cause a bit of a bounce, but it’s also possible we turn around right in this area. Keep in mind that this pair is highly sensitive to risk appetite around the world, and therefore you think about the Japanese yen as a “safety currency”, and therefore if people get scared again it will send this pair lower. The market had initially shot higher to reach to a fresh, new high and as long as we don’t make a fresh, new low, we are still in an uptrend.
To the upside I still see the ¥111 level as a gap that needs to be filled, and it should cause a certain amount of resistance. If we break above that level, then it’s likely that the ¥112.33 level will be targeted after that as it is the 100% Fibonacci retracement level. When I look at the longer-term charts, there are some other things to pay attention to as well, and it should be noted that the ¥110 level is essentially the “fair value” in the overall consolidation.
That being said, longer-term we are looking at either a pullback to the ¥105 level, or perhaps a breakout to the ¥115 level after that. At this point, the market is very likely to continue to see a lot of choppiness and volatility, and it should be noted that we need to pay attention to the most recent high and most recent low for directionality. Beyond that, there isn’t much to know other than we will continue to move based upon overall risk appetite and sentiment in general. The candlestick on Friday was very negative, but in the prism of the last couple of weeks, we are still well within the tolerance of a simple pullback from an impulsive move to the upside.

