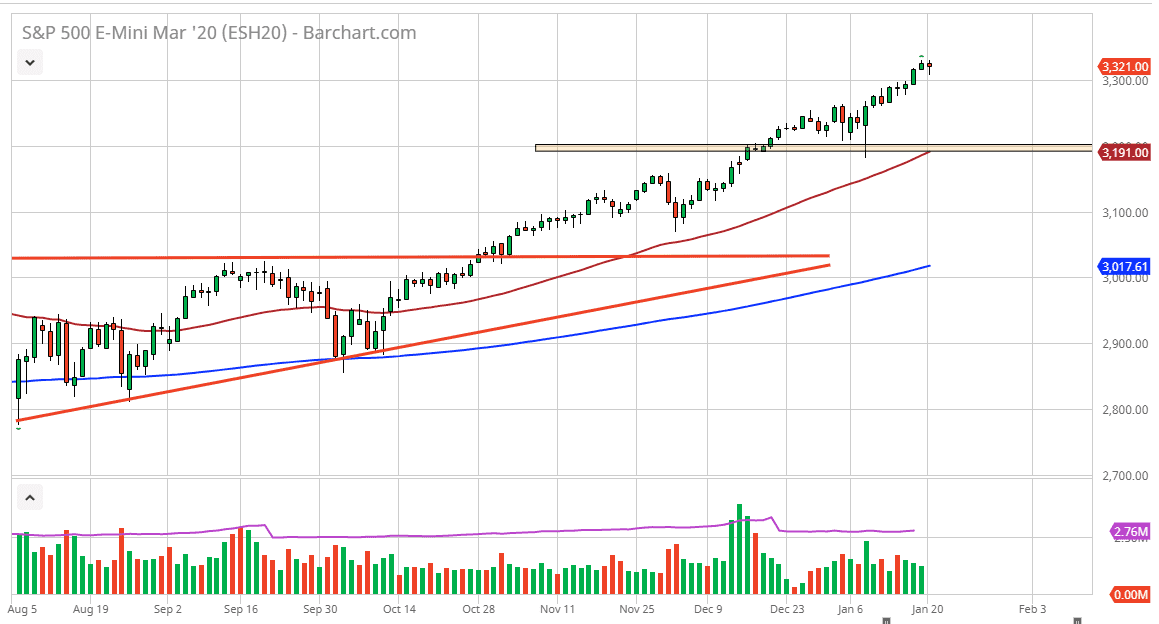
The S&P 500 should continue to find buyers on pullbacks going forward, and therefore the fact that we did up forming a bit of a hammer like candle sitting on top of the 3300 level is very good sign from what I can see. If we were to break down below the candlestick, it would be a somewhat negative sign, as it would turn into a “hanging man.” If we were to break down below that level, then I think the market is likely to go looking towards the 3250 level, perhaps even the 3200 level after that. That being said, I have no interest in trying to short this market, because quite frankly it is far too bullish from a longer-term standpoint.
Looking at this market, it’s likely that the 3200 level will continue to offer support due to the fact that the 50 day EMA is crossing above that level and it is of course previous support anyway. At this point, it’s likely that we will see a lot of interest in that area but even if we were to break down below there, I think there are multiple points on the chart that may bring in buying. Keep in mind though that the session was relatively quiet considering that Boeing had driven down the Dow Jones Industrial Average.
If we do break above the top of the candlestick, it’s very unlikely that we can extend that move for very long and it would probably lead into a short-term extremely overbought situation. I do believe that this market is a little overbought anyways, so I like the idea of taking advantage of value when it appears in not simply jumping in with both feet and trying to “chase the trade. In fact, that’s probably one of the biggest blunders retail traders may, so there’s no point in trying to do that. Ultimately, this is a market that cannot be sold because it has proven itself to be so massively resilient over the longer term. That being said, you probably have the ability to wait on a daily candlestick to make your decision, because we certainly will have a lot of intraday noise that will cause a lot of problems. Because of this, it’s very likely that you have plenty of time to take advantage of dips going forward as they tend to last for several days at a time.

