The difference between success and failure in Forex trading is very likely to depend upon which currency pairs you choose to trade each week, and not on the exact trading methods you might use to determine trade entries and exits. Each week I am going to analyze fundamentals, sentiment and technical positions in order to determine which currency pairs are most likely to produce the easiest and most profitable trading opportunities over the next week. In some cases, it will be trading the trend. In other cases, it will be trading support and resistance levels during more ranging markets.
Big Picture 12th January 2020
In my previous piece last week, I forecasted that the best trades were likely to be long of Gold in USD terms and short of the USD/CAD currency pair. Gold rose by 0.63% over the week while the USD/CAD currency pair rose by 0.47%. These were good calls overall as these trades produced an averaged win of 0.08%.
Last week’s Forex market saw the strongest rise in the relative value of the U.S. Dollar, and the strongest fall in the relative value of the Japanese Yen.
Fundamental Analysis & Market Sentiment
Fundamental analysts are leaning in favor of the view that a further cut in the U.S. interest rate has become more possible after last week’s NFP data showed a weaker than expected U.S. employment situation.
The U.S. economy is still growing, but there are some fears of a pending recession. A major issue concerning sentiment on the U.S. and global economies is the trade dispute between the U.S. and China, although the situation has improved here as it seems that “Phase One” of a U.S. / China trade deal is near completion.
Market sentiment was dominated last week by the aftermath of the U.S. / Iran clash in Iraq. Tensions have cooled as it seems likely that no further measures will be taken immediately by either side, which improved risk appetite.
We are seeing valid long-term trends in the S&P 500 Index (bullish), Gold (still bullish after a retracement), and the USD/JPY currency pair which may be poised to make a long-term bullish breakout beyond the 110.00 area.
Technical Analysis
U.S. Dollar Index
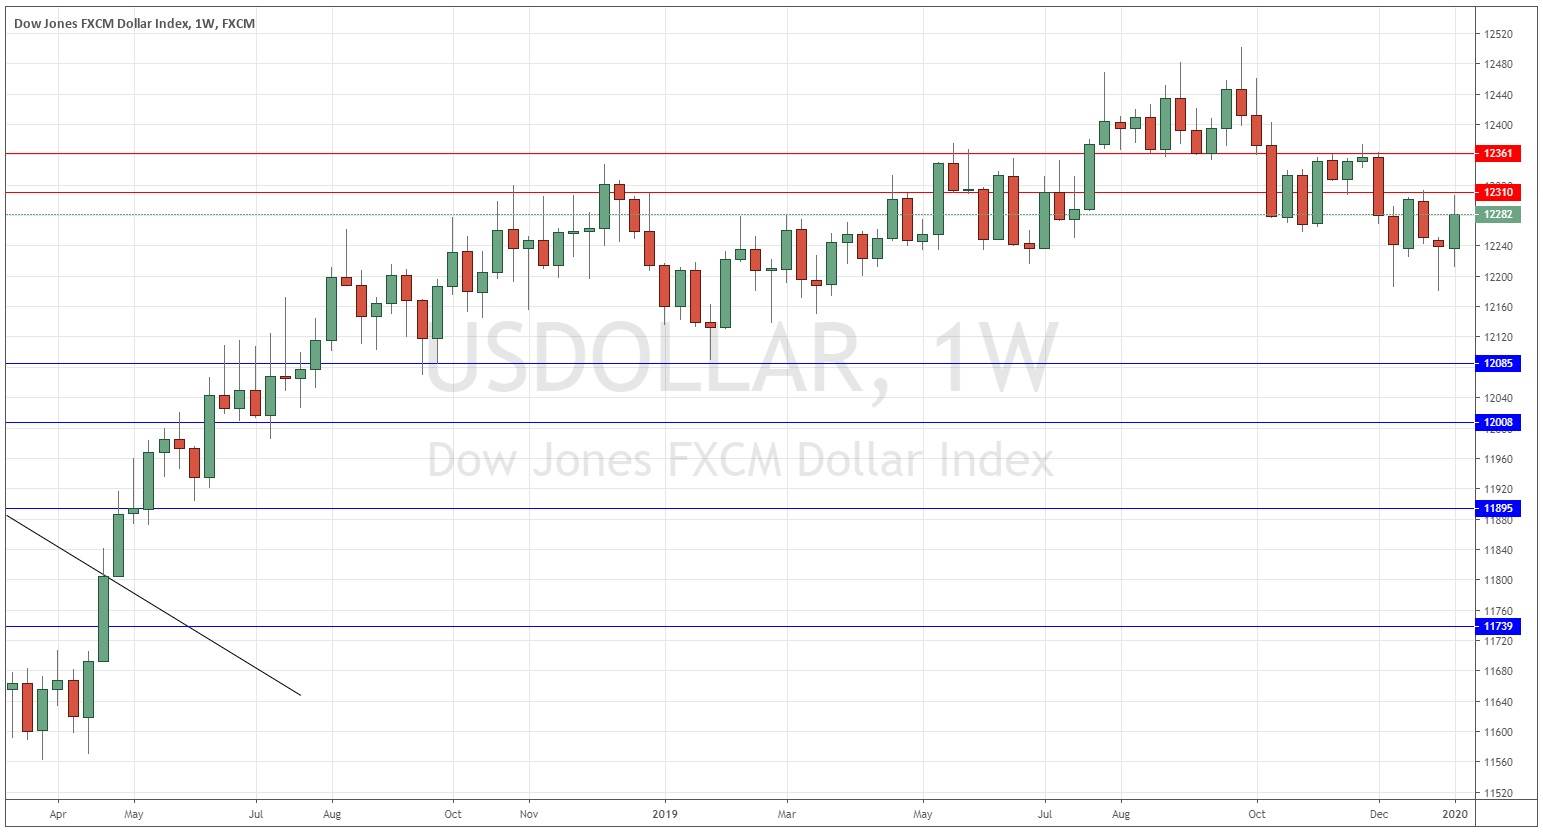
The weekly price chart below shows last week printed a bullish candlestick, which closed within the top half of its price range. This is a weakly bullish sign, but the price is below its level from 6 months ago but is also just above its level from 3 months ago, which indicates an absence of a clear trend. The price is still below the lower key resistance level at 12310 which is a bearish sign. We have mixed signs here, and the short-term bullish action makes this week’s direction hard to predict.
S&P 500 Index
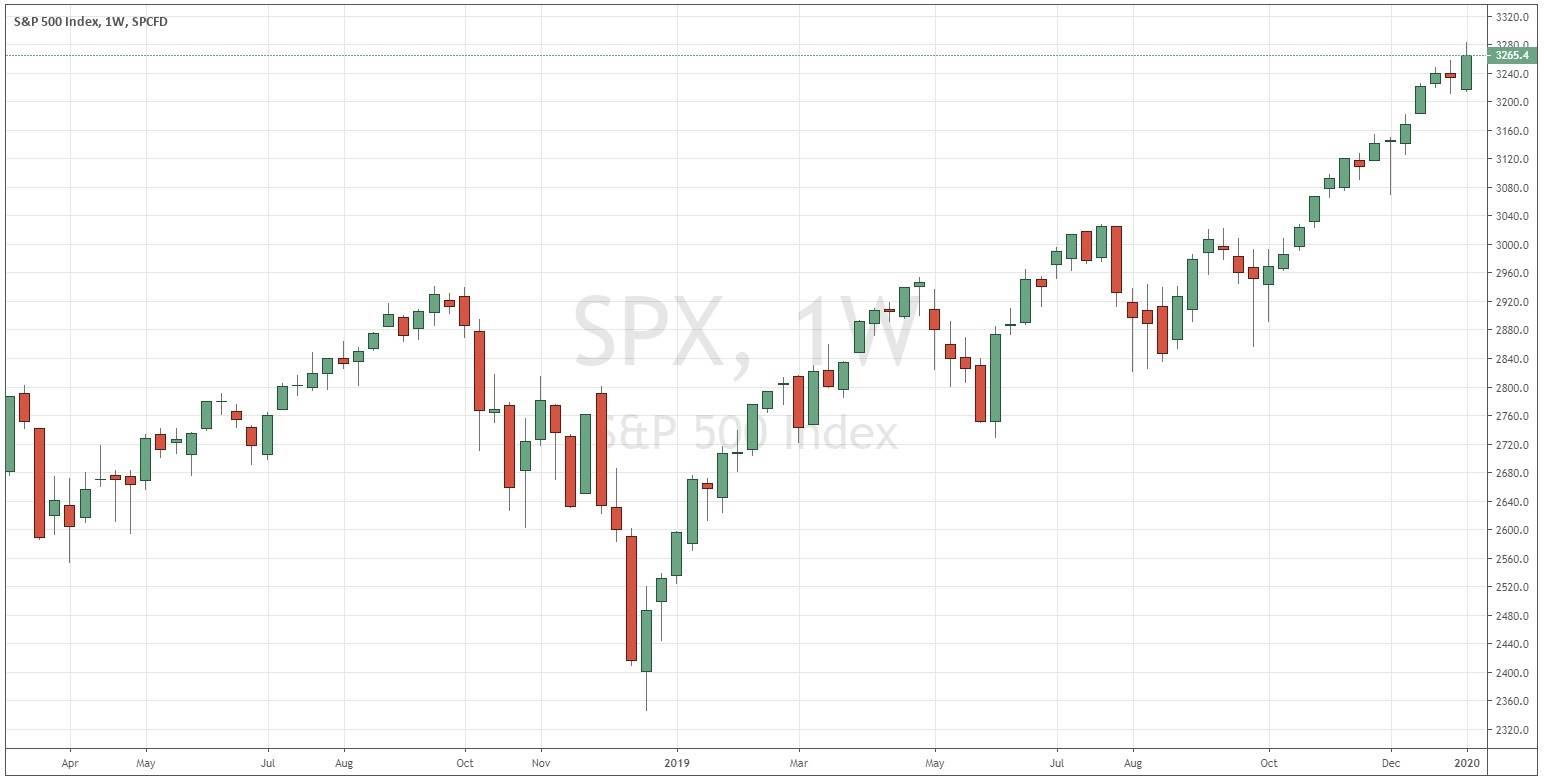
The S&P 500 Index just made its highest ever weekly close. This is always a bullish sign and recent price data shows that after this even there is typically a 53% chance that next week will close higher still. Last week’s candlestick was bullish on above-average volatility and closed within the top half of its range, both of which are bullish signs. However, it would be wise to wait for a daily close above 3275 before entering a new long trade, as the highest daily close last week was just below that level and exceeding it at a close would be a helpful bullish sign.
Gold/USD
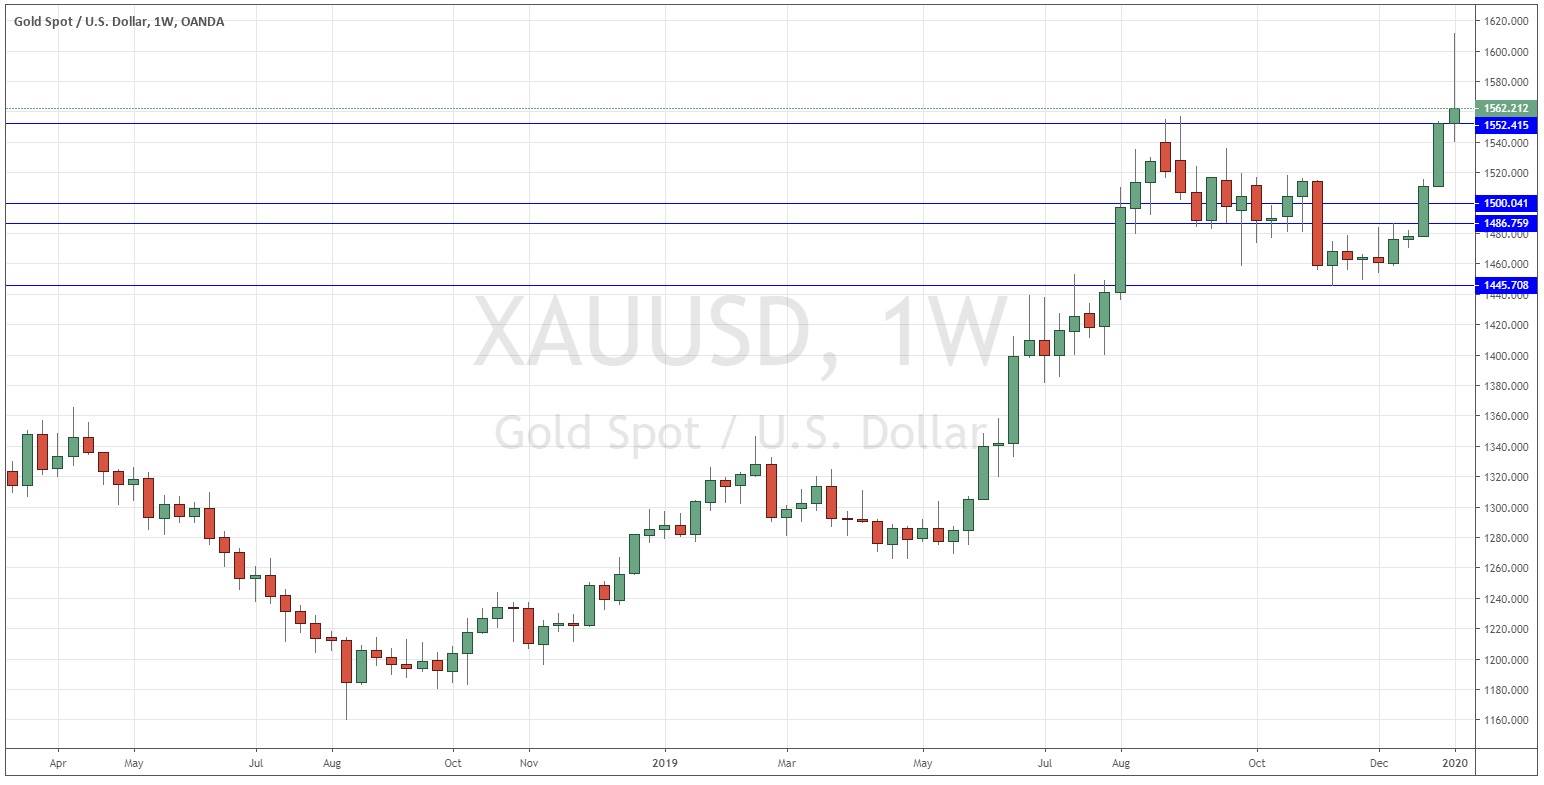
Gold in USD terms just made its highest weekly close in more than 6 and a half years at the end of last week. Last week’s candlestick candlestick was bullish on above average volatility, which is a bullish sign, but the close was near the low so it may be a pin or near pin bar. There is a long-term bullish trend, but bulls need to see a daily close above $1575 before getting confident again. Gold currently seems to benefit strongly from “risk off” sentiment in the market as a safe have, making its peak last week just as news broke that Iran had launched a ballistic missile attack against U.S. military bases in Iraq.
Conclusion
This week I forecast the best trades are likely to be long of gold in USD terms following a daily close above $1575 and long of the S&P 500 Index in USD terms following a daily close above 3275.


