According to one New Zealand business manufacturing gauge, the sector unexpectedly contracted in December. Forex traders ignored this report and chose to focus on Chinese data, which confirmed annualized GDP growth at 6.1% for 2019. Adding to the moderately bullish tone during the Asian trading session was a surprise increase in Chinese industrial production and fixed asset investment. The NZD/USD managed to stabilize inside of its short-term support zone.
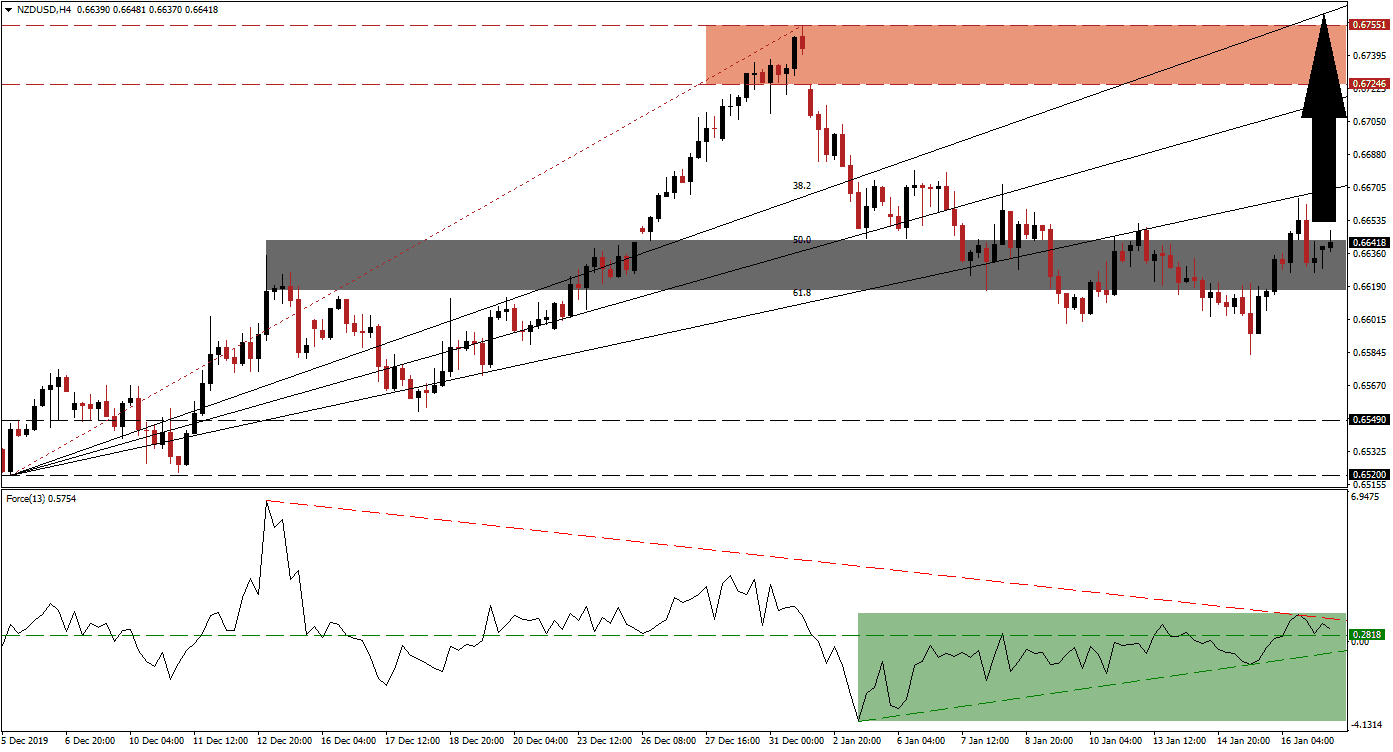
The Force Index, a next-generation technical indicator, provided an early sign that the corrective phase in this currency pair is nearing its end. Bullish momentum started to increase, while price action extended its contraction, and a positive divergence formed. The Force Index then converted its horizontal resistance level into support, as marked by the green rectangle. This technical indicator additionally pushed into positive territory, placing bulls in charge of the NZD/USD. It is now faced with its descending resistance level, but a breakout is anticipated.
After this currency pair recovered from a breakdown below its short-term support zone, it accelerated to higher high above it, ending the move to the downside. This zone is located between 0.66165 and 0.66428, as marked by the red rectangle. The recovery was rejected by its ascending 61.8 Fibonacci Retracement Fan Resistance Level, but given the rising bullish momentum, a second attempt is favored. Forex traders are advised to monitor the intra-day high of 0.66646, the peak of the current advance. A breakout in the NZD/USD above it is likely to result in more net buy orders. You can learn more about the Fibonacci Retracement Fan here.
Following a breakout in this currency pair above its previous peak, a short-covering rally may emerge. The Fibonacci Retracement Fan sequence is then favored to guide the NZD/USD to the upside. An advance into its resistance zone located between 0.67246 and 0.67551, as marked by the red rectangle, expected. With the 38.2 Fibonacci Retracement Fan Resistance Level already above this zone, more upside is possible. You can read more about a short-covering rally here.
NZD/USD Technical Trading Set-Up - Breakout Scenario
Long Entry @ 0.66400
Take Profit @ 0.67550
Stop Loss @ 0.66100
Upside Potential: 115 pips
Downside Risk: 30 pips
Risk/Reward Ratio: 3.83
In the event of a breakdown in the Force Index below its ascending support level, the NZD/USD may attempt a push to the downside. Given the fundamental outlook for this currency pair, supported by technical developments, any breakdown remains limited to its long-term support zone between 0.65200 and 0.65490. Forex traders should consider this an excellent buying opportunity.
NZD/USD Technical Trading Set-Up - Limited Breakdown Scenario
Short Entry @ 0.65750
Take Profit @ 0.65200
Stop Loss @ 0.66000
Downside Potential: 55 pips
Upside Risk: 25 pips
Risk/Reward Ratio: 2.20

