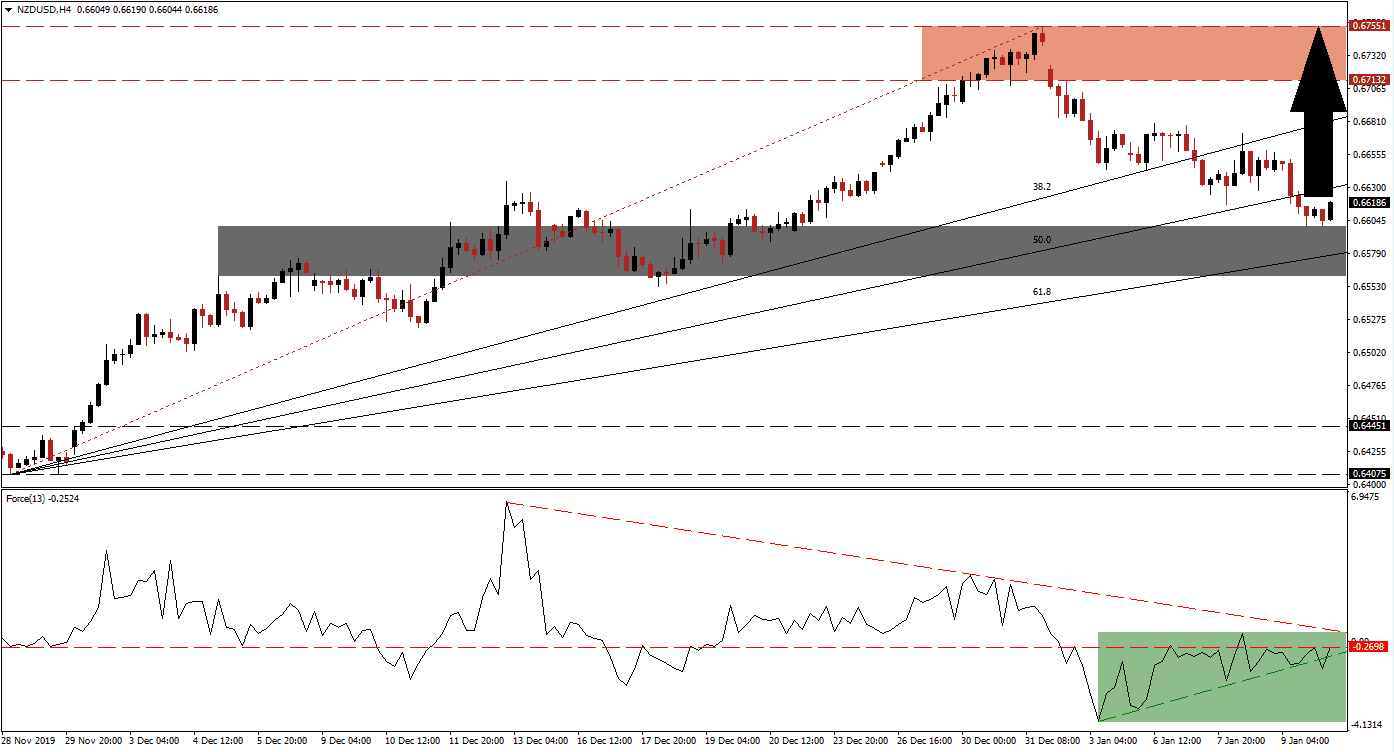
Bullish momentum is expanding after this currency pair grazed the top range of its short-term support zone. The corrective phase in the NZD/USD was a necessary development as part of the long-term bullish trend. It also ensured the longevity of the advance, and the ascending Fibonacci Retracement Fan sequence is anticipated to guide price action farther to the upside. A fresh breakout sequence should be expected, and today’s NFP report out of the US may provide a short-term catalyst.
The Force Index, a next-generation technical indicator, started to recover from its new low as the NZD/USD closed in on its 38.2 Fibonacci Retracement Fan Support Level. Price action continued its sell-off, and a positive divergence formed. Momentum stalled after the Force Index briefly pushed above its horizontal resistance level, and this technical indicator reversed slightly. Its ascending support level is now applying breakout pressure in negative territory, as marked by the green rectangle. You can learn more about the Force Index here.
After price action approached its short-term support zone located between 0.65610 and 0.65995, as marked by the grey rectangle, selling pressure faded. This zone is enforced by its 61.8 Fibonacci Retracement Fan Support Level, and a short-covering rally is anticipated to follow. Forex traders are advised to monitor the intra-day high of 0.66348, the peak of a previous breakout. A push through this level is likely to result in the addition of new net long positions in the NZD/USD.
Current technical developments suggest an advance in this currency pair, which will take it back into its resistance zone. A full recovery will also close a minor price gap to the downside. The resistance zone is located between 0.67132 and 0.67551, as marked by the red rectangle. Volatility is favored to increase after the release of today’s NFP report out of the US, but the long-term bullish trend in the NZD/USD is expected to remain intact. You can learn more about a resistance zone here.
NZD/USD Technical Trading Set-Up - Short-Covering Scenario
Long Entry @ 0.66150
Take Profit @ 0.67550
Stop Loss @ 0.65750
Upside Potential: 140 pips
Downside Risk: 40 pips
Risk/Reward Ratio: 3.50
In case of a new push to the downside in the Force Index, supported by its descending resistance level, the NZD/USD could attempt a breakdown below its short-term support zone. While a temporary contraction cannot be ruled out, forex traders should view this as an excellent buying opportunity. The downside potential is limited to its long-term support zone located between 0.64075 and 0.64451.
NZD/USD Technical Trading Set-Up - Limited Breakdown Scenario
Short Entry @ 0.65150
Take Profit @ 0.64450
Stop Loss @ 0.65450
Downside Potential: 70 pips
Upside Risk: 30 pips
Risk/Reward Ratio: 2.33

