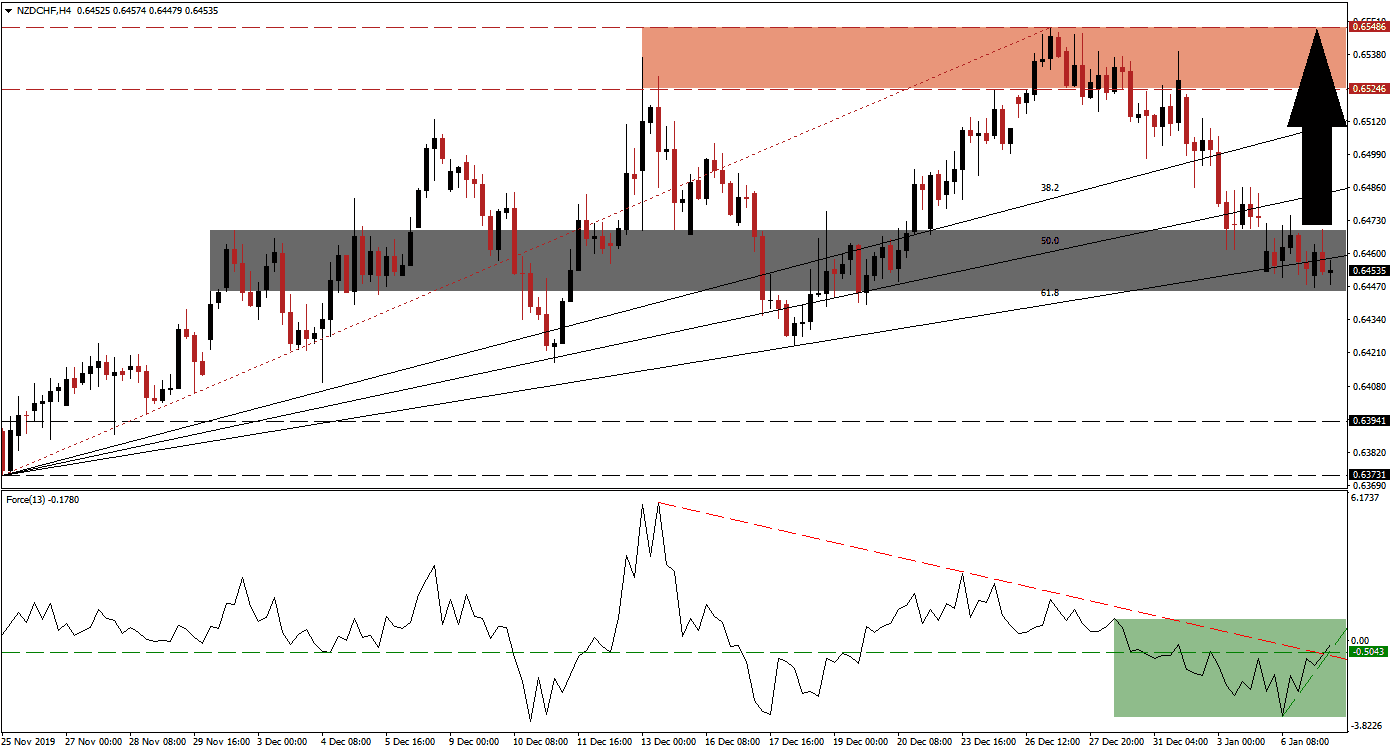
During the immediate aftermath of the rise in Middle East tensions, safe-have assets like the Swiss Franc were in demand. This aided the sell-off in the NZD/CHF, leading to a breakdown below its resistance zone and its entire Fibonacci Retracement Fan sequence. As the initial panic-selling concluded, a reversal is anticipated. Bullish momentum in this currency pair started to recover as price action reached the bottom range of its short-term support zone. You can learn more about the Fibonacci Retracement Fan here.
The Force Index, a next-generation technical indicator, recorded a marginally higher low before reversing to the upside. Bullish momentum sufficed to push the Force Index above its horizontal resistance level, turning it into support. It additionally resulted in a breakout above its descending resistance level, as marked by the green rectangle. This technical indicator is now anticipated to extend its advance into positive conditions, placing bulls in control of the NZD/CHF. A breakout sequence in this currency pair is likely to follow.
Price action did move below its ascending 61.8 Fibonacci Retracement Fan Support Level and turned it into temporary resistance. This materialized inside of its short-term support zone located between 0.64453 and 0.64691, as marked by the grey rectangle. Forex traders are advised to monitor the NZD/CHF inside its support zone, as a breakdown will invalidate the long-term uptrend and may lead to a more excessive corrective phase. The rise in bullish momentum suggests that a short-covering rally may be imminent, but downside risks should not be ignored.
Economic data will capture the focus of traders after the US is boosting its military presence in the Persian Gulf, countering claims of a full troop withdrawal from Iraq. Swiss economic data has been soft, and deflationary pressures are on the rise, despite the Swiss National Bank’s accommodative monetary policy. Today’s CPI data may provide a short-term catalyst to initiate a breakout sequence in the NZD/CHF. Price action is favored to recover into its resistance zone located between 0.65249 and 0.65489, as marked by the red rectangle. You can learn more about a breakout here.
NZD/CHF Technical Trading Set-Up - Price Action Reversal Scenario
Long Entry @ 0.64550
Take Profit @ 0.65450
Stop Loss @ 0.64250
Upside Potential: 90 pips
Downside Risk: 30 pips
Risk/Reward Ratio: 3.00
A breakdown in the Force Index below its ascending support level is expected to lead the NZD/CHF into a breakdown below its short-term support zone. This will extend the corrective phase into its next long-term support zone located between 0.63731 and 0.63941. Forex traders should consider this an excellent buying opportunity, as the fundamental outlook for this currency pair remains bullish.
NZD/CHF Technical Trading Set-Up - Limited Breakdown Scenario
Short Entry @ 0.64150
Take Profit @ 0.63750
Stop Loss @ 0.64350
Downside Potential: 40 pips
Upside Risk: 20 pips
Risk/Reward Ratio: 2.00

