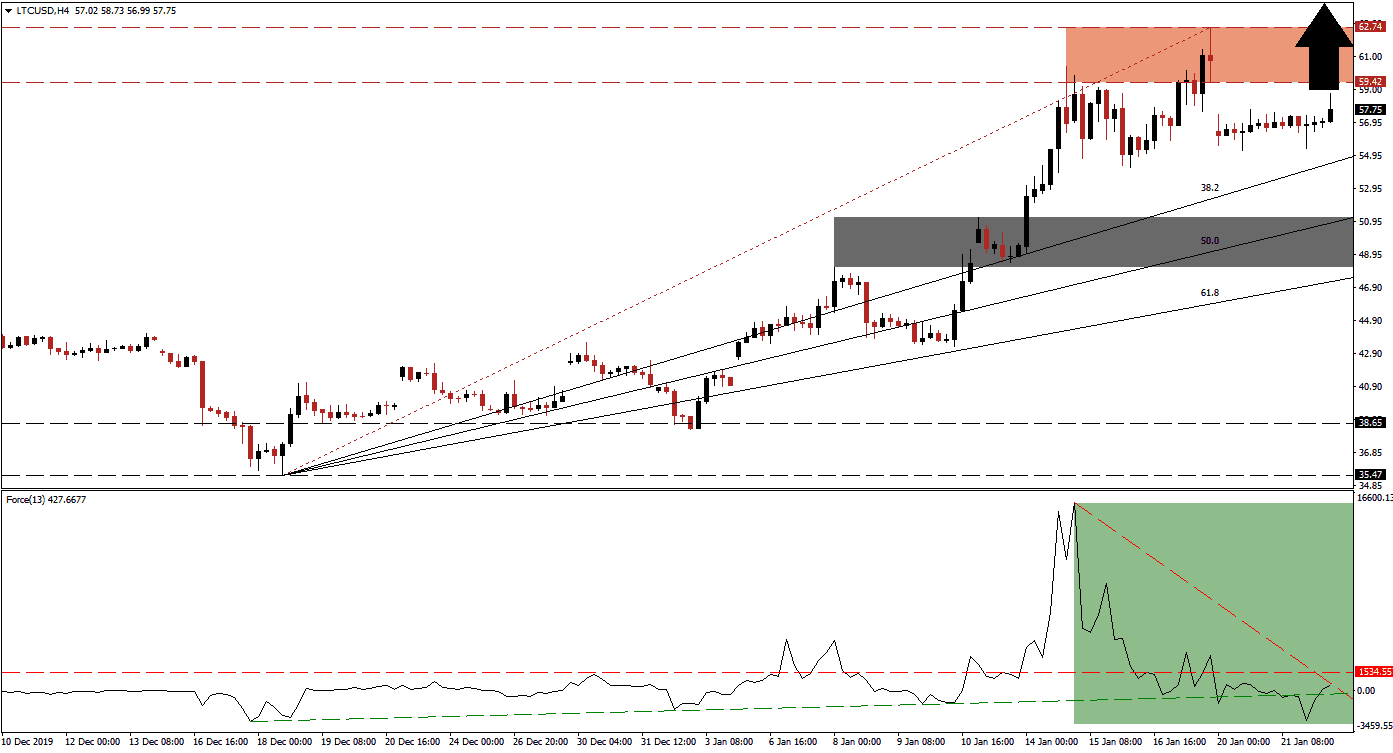
With the start of 2020, bullishness across the cryptocurrency sector added to gains, which started to emerge in December 2019. At the start of the year, a spike in tensions between the US and Iran resulted in a sharp rally in gold that was mirrored by Bitcoin. It lifted the overall positive mood, and most cryptocurrency pairs enjoyed a strong advance. As price action has approached key resistance levels, a divergence is favored to end the unison move higher by the market. The LTC/USD is well-positioned to attempt a second breakout attempt, after reversing below its resistance zone.
The Force Index, a next-generation technical indicator, initially spiked to a new multi-month high together with this cryptocurrency pair. After the LTC/USD reached its resistance zone, bullish momentum collapsed. A negative divergence materialized, and the Force Index contracted below its horizontal support level, turning it into resistance. This technical indicator briefly dropped below its ascending support level, as marked by the green rectangle. A quick recovery elevated the Force Index into positive territory and placed bulls in charge of price action. You can learn more about an ascending support level here.
Following the advance into its resistance zone located between 59.42 and 62.74, as marked by the red rectangle, the LTC/USD was faced with a price gap to the downside. This failed to spark a profit-taking sell-off and added to the long-term bullish outlook for this cryptocurrency pair. The ascending Fibonacci Retracement Fan sequence is anticipated to provide enough pressure to force a breakout. From a fundamental perspective, the recovery in the hashrate is inviting price action to the upside. You can learn more about the Fibonacci Retracement Fan here.
Volatility is expected to increase as the LTC/USD is on the verge of attempting a second breakout, inspired by its 38.2 Fibonacci Retracement Fan Support Level. This level has aided in the conversion of its previous short-term resistance zone into support, which is located between 48.15 and 51.21, as marked by the grey rectangle. A confirmed breakout from current levels is likely to take this cryptocurrency pair into its next resistance zone located between 75.56 and 79.79, which will close two price gaps to the downside.
LTC/USD Technical Trading Set-Up - Breakout Scenario
Long Entry @ 57.75
Take Profit @ 79.75
Stop Loss @ 51.00
Upside Potential: 2,200 pips
Downside Risk: 675 pips
Risk/Reward Ratio: 3.26
In case of a reversal in the Force Index into negative territory, assisted by its descending resistance level, the LTC/USD is expected to attempt a breakdown. Traders are advised to remain patient in the event of a correction, as a move into its 61.8 Fibonacci Retracement Fan Support Level will keep the uptrend intact. A move below it may take price action into its support zone located between 35.47 and 38.65, which will provide an outstanding buying opportunity.
LTC/USD Technical Trading Set-Up - Limited Breakdown Scenario
Short Entry @ 46.00
Take Profit @ 38.50
Stop Loss @ 49.00
Downside Potential: 750 pips
Upside Risk: 300 pips
Risk/Reward Ratio: 2.50

