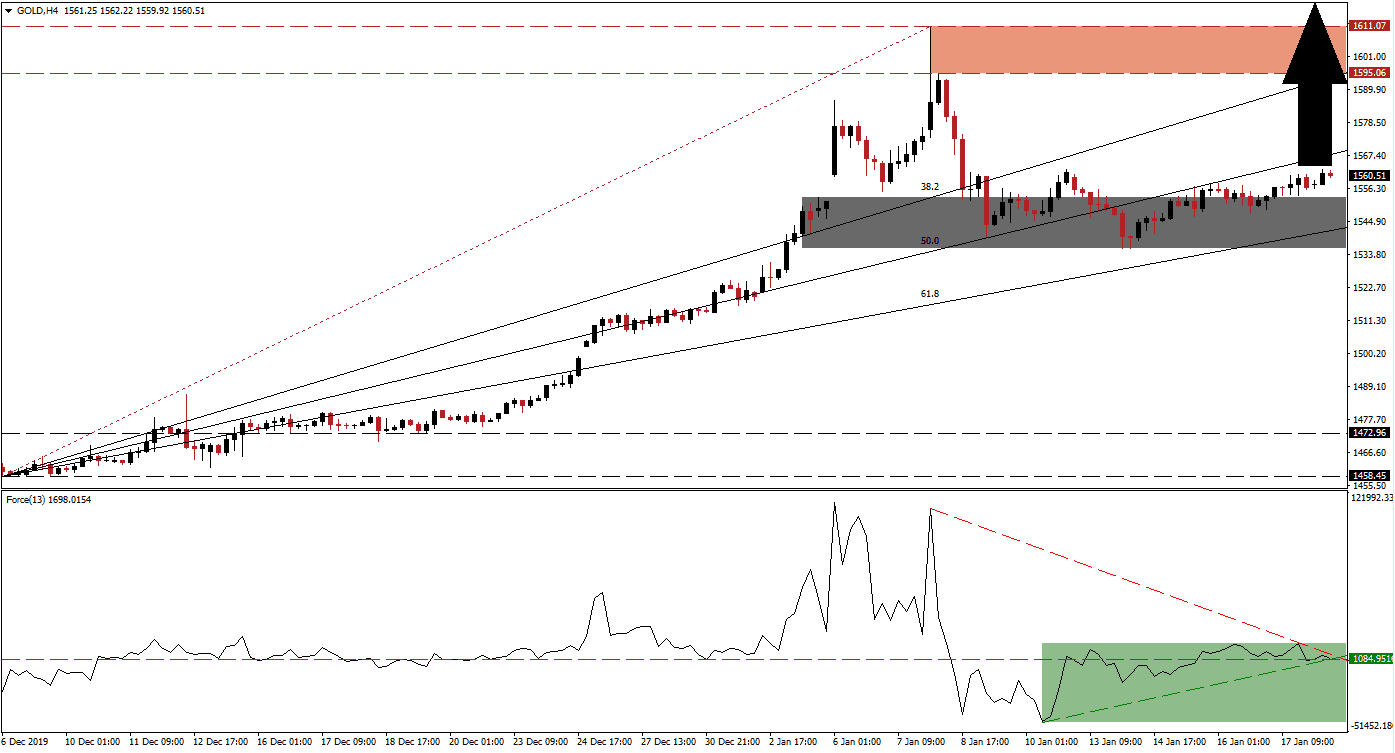
Tensions between the US and Iran at the start of 2020 allowed gold to spike above the psychological $1,600 level for the first time since the end of the first quarter in 2013. As the situation cooled down, price action retreated due to a profit-taking sell-off, but bullish momentum remains dominant. This precious metal retreated into its short-term support zone and closed a previous price gap to the upside. Due to the correction, the longevity of the long-term uptrend has been ensured.
The Force Index, a next-generation technical indicator, started to recover from a lower low following its steep drop. As gold drifted higher, the Force Index converted its horizontal resistance level into support, as marked by the green rectangle. It also remains in positive territory with bulls in charge of gold. This technical indicator is now favored to complete a breakout above its descending resistance level, initiated by its ascending support level. Price action should follow with a breakout of its own.
Gold has already completed a breakout above its short-term support zone located between 1,535.80 and 1,553.16, as marked by the grey rectangle. This commodity is begin guided higher inside of a price channel created by its ascending 61.8 Fibonacci Retracement Fan Support Level, and its 50.0 Fibonacci Retracement Fan Resistance Level. With the global economic outlook dim, geopolitical tensions elevated, and central banks buying gold while maintaining ultra-lose monetary policies, a breakout is anticipated to emerge.
Traders are recommended to monitor the intra-day high of 1,562.80, the peak of a previous breakout above its short-term support zone that was reversed into a lower low. A confirmed push above this level is expected to result in new net long positions, providing volume for an advance into its next resistance zone. This zone awaits price action between 1,595.06 and 1,611.07, as marked by the red rectangle. More upside is likely to follow, given the rise in demand. The next resistance zone is located between 1,672.22 and 1,696.41, dating back to November 2012. You can learn more about a resistance zone here.
Gold Technical Trading Set-Up - Breakout Extension Scenario
Long Entry @ 1,560.00
Take Profit @ 1,695.00
Stop Loss @ 1,520.00
Upside Potential: 13,500 pips
Downside Risk: 4,000 pips
Risk/Reward Ratio: 3.38
Should the Force Index sustain a breakdown below its ascending support level, gold is anticipated to drift into the bottom range of its short-term support zone. A breakdown cannot be ruled out, but the downside potential is limited to its next long-term support zone located between 1,458.45 and 1,472.96. This will represent an outstanding buying opportunity.
Gold Technical Trading Set-Up - Limited Breakdown Scenario
Short Entry @ 1,495.00
Take Profit @ 1,460.00
Stop Loss @ 1,510.00
Downside Potential: 3,500 pips
Upside Risk: 1,500 pips
Risk/Reward Ratio: 2.33

