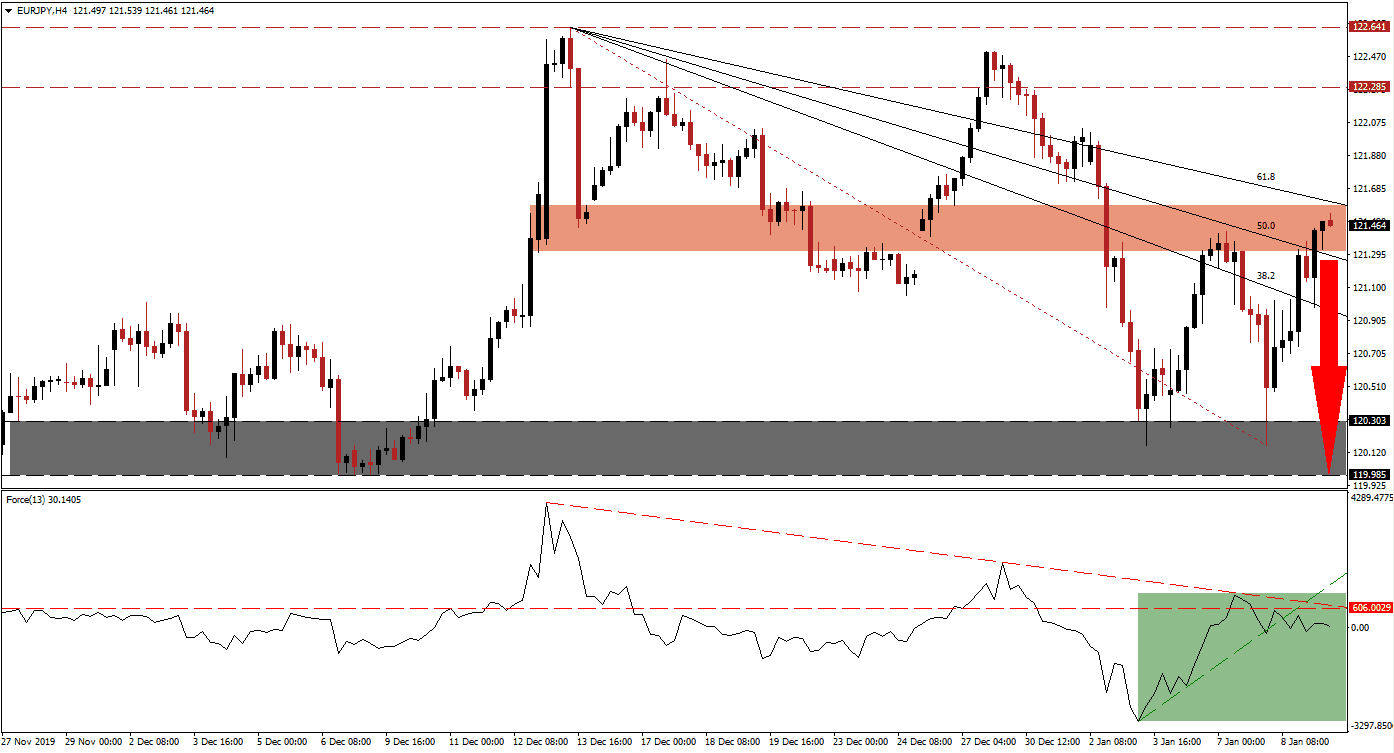
Eurozone economic data, led by Germany, continues to show structural weakness. Geopolitical tensions have eased as Iran appears to stand down following one retaliatory strike, which led to an exodus of capital from safe-haven assets like gold and the Japanese Yen. The EUR/JPY accelerated out of its support zone and pushed into its short-term resistance zone with a higher. This bullish development is offset by a contraction in bullish momentum. You can learn more about the support and resistance zones here.
The Force Index, a next-generation technical indicator, initially rebounded with this currency pair and briefly eclipsed its horizontal resistance level. Bullish momentum eased as the descending resistance level pressured the Force Index to the downside. It additionally led to a breakdown below its ascending support level, as marked by the green rectangle. This technical indicator is now expected to move into negative conditions, placing bears in control of the EUR/JPY.
Price action recorded a higher high inside of its short-term resistance zone located between 121.315 and 121.586, as marked by the red rectangle. This closed a previous price gap to the upside, but the descending 61.8 Fibonacci Retracement Fan Resistance Level has halted to advance. The exhausted upside is now vulnerable to a corrective phase, and the Fibonacci Retracement Fan is favored to maintain the long-term bearish trend in the EUR/JPY. Forex traders should be on alert for a potential double breakdown, which may initiate a profit-taking sell-off.
As breakdown pressures are on the rise, a fundamental catalyst may provide the spark for the next move in this currency pair. Should this currency pair descend below the intra-day low of 120.983, a previous low that led to the latest push higher, a fresh wave of sell orders is favored. It will also place the EUR/JPY below its 38.2 Fibonacci Retracement Fan Support Level. Price action will have a clear path into its support zone, located between 119.985 and 120.303, as marked by the grey rectangle. You can learn more about a breakdown here.
EUR/JPY Technical Trading Set-Up - Breakdown Scenario
Short Entry @ 121.450
Take Profit @ 120.000
Stop Loss @ 121.750
Downside Potential: 145 pips
Upside Risk: 30 pips
Risk/Reward Ratio: 4.83
Should the Force Index maintain a breakout above its descending resistance level, the EUR/JPY is anticipated to mirror such a development. Given the bearish outlook on this currency pair, the upside potential after a breakout is limited to its long-term resistance zone between 122.285 and 122.641. Forex traders are advised to consider this a good short-selling opportunity.
EUR/JPY Technical Trading Set-Up - Limited Breakout Scenario
Long Entry @ 122.100
Take Profit @ 122.600
Stop Loss @ 121.850
Upside Potential: 50 pips
Downside Risk: 25 pips
Risk/Reward Ratio: 2.00

