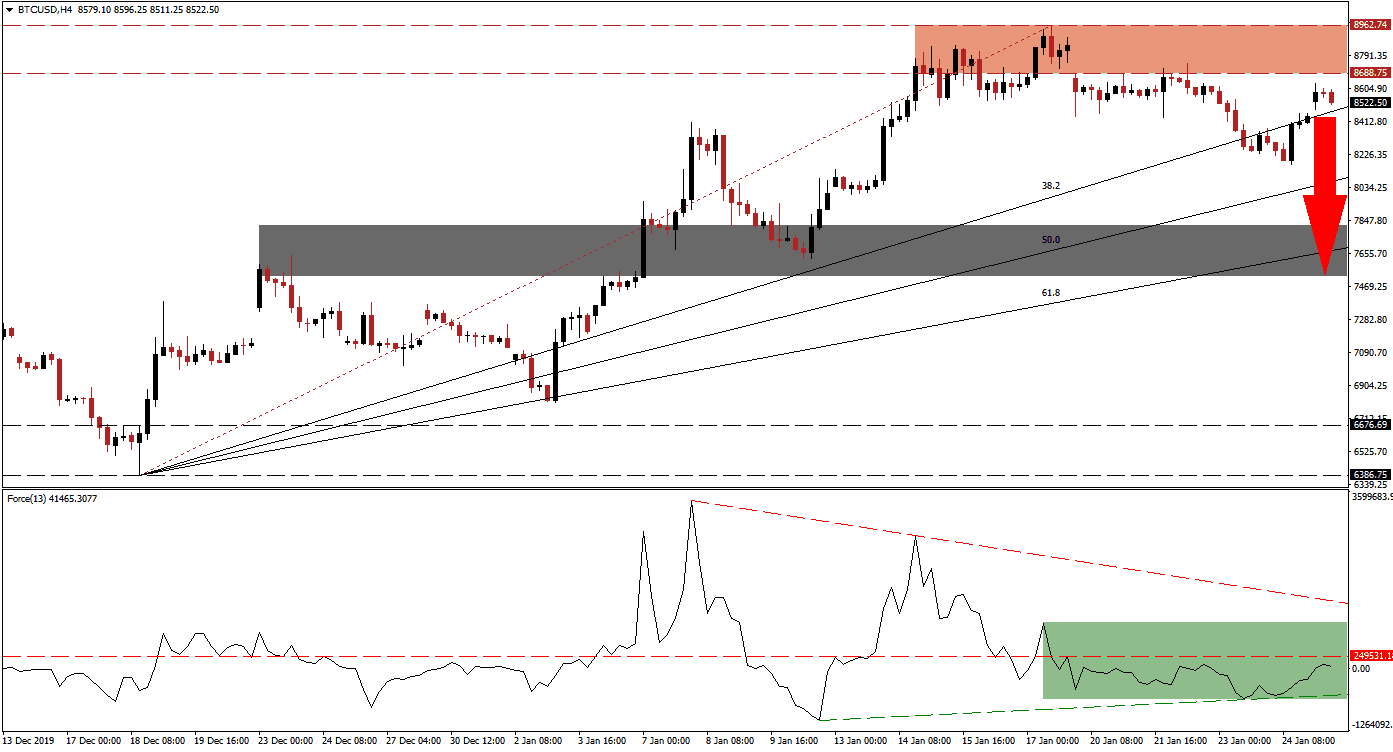
Bitcoin lost its bullish momentum after completing a breakdown below its resistance zone. Volatility increased as this cryptocurrency pair briefly dipped below its ascending 38.2 Fibonacci Retracement Fan Support Level. While price action recovered, bullish momentum remains subdued, and a renewed push to the downside is expected to follow. The uptrend in the BTC/USD has been violated, as the breakdown resulted in a lower low. You can learn more about the Fibonacci Retracement Fan here.
The Force Index, a next-generation technical indicator, provided an early indicator that the rally is nearing an end with the emergence of a negative divergence, as price action initially advanced into its resistance zone. The Force Index then contracted below its horizontal support level, converting it into resistance. A higher low allowed for an ascending support level to form, as marked by the green rectangle. This technical indicator remains in negative territory, with bears in control of the BTC/USD.
This cryptocurrency pair completed its breakdown below its resistance zone with a price gap to the downside. A minor reversal resulted in a lower high, and price action accelerated to the downside. The BTC/USD is now being rejected for the third time by its resistance zone located between 8,688.75 and 8,962.74, as marked by the red rectangle. Adding to pressures for either a breakout or breakdown is the Fibonacci Retracement Fan sequence, with the 38.2 Fibonacci Retracement Fan Support Level closing in on the bottom range of the resistance zone.
Failure to push higher from current levels is likely to result in a profit-taking sell-off in the BTC/USD. One key level to monitor is the intra-day low of 8,168.10, the low of the previous breakdown. A move below this level is anticipated to invite the net wave of net sell positions into this cryptocurrency pair. It should additionally provide the necessary push for a contraction until price action will reach its short-term support zone. This zone is located between 7,526.25 and 7,821.00, as marked by the grey rectangle. A further breakdown will require a fresh catalyst, but cannot be ruled out due to the long-term bearish chart pattern.
BTC/USD Technical Trading Set-Up - Profit-Taking Scenario
Short Entry @ 8,525.00
Take Profit @ 7,525.00
Stop Loss @ 8,850.00
Downside Potential: 100,000 pips
Upside Risk: 32,500 pips
Risk/Reward Ratio: 3.08
In case of a double breakout in the Force Index, which will take it above its descending resistance level, the BTC/USD is favored to follow suit with a breakout of its own. This should take price action into its next resistance zone between 9,527.03 and 9,873.63, from where an attempt at the psychological 10,000 resistance level appears likely. While the long-term fundamental outlook remains bullish, short-term technical weakness persists.
BTC/USD Technical Trading Set-Up - Breakout Scenario
Long Entry @ 9,075.00
Take Profit @ 9,725.00
Stop Loss @ 8,850.00
Upside Potential: 65,000 pips
Downside Risk: 22,500 pips
Risk/Reward Ratio: 2.89

