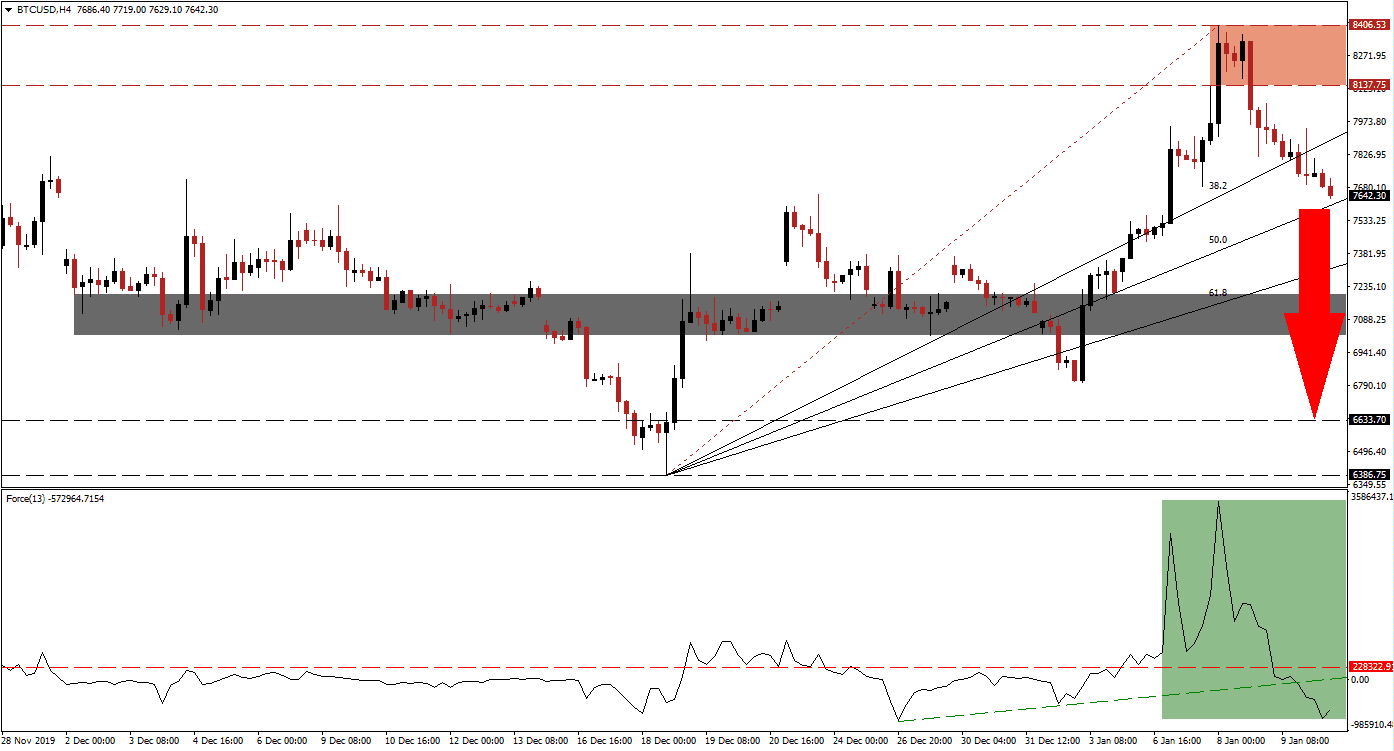
Bitcoin spiked together with safe-haven assets like gold, as tensions between the US and Iran flared up. After an apparent easing of the situation, safe-haven assets reversed sharply. The BTC/USD mirrored this pullback, providing traders more evidence that Bitcoin has taken the role of value storage when volatility rises. A growing number of analysts refer to Bitcoin as digital gold, and price action behavior confirms this comparison. Following the breakdown below its resistance zone and its ascending 38.2 Fibonacci Retracement Fan Support Level, more downside is expected.
The Force Index, a next-generation technical indicator, confirmed the price spike, which took this cryptocurrency pair above the $8,400 level. Bullish momentum contracted quickly, suggesting that the rally was a short-term reaction to a geopolitical event, rather than a long-term move based on fundamentals. The Force Index converted its horizontal support level into resistance, as marked by the green rectangle. Downside momentum also pressured this technical indicator into a breakdown below its ascending support level, and deep into negative territory. Bears are in control of price action.
Volatility returned to Bitcoin, evident by the advance that resulted in a 23.54% rally in this cryptocurrency pair over five days. After the breakdown in the BTC/USD below its resistance zone located between 8,137.75 and 8,406.53, as marked by the red rectangle, a 9.13% correction emerged over two days, with more downside favored. Over the past seven days, there was no fundamental change in Bitcoin, offering more evidence that it may be more correlated to the rest of the financial system than previously thought. The rise in institutional demand has brought price action in-line with the global system.
Due to the magnitude of bearish pressures, the BTC/USD is anticipated to descend into its next short-term support zone located between 7,016.55 and 7,198.76, as marked by the grey rectangle. This will close a previous price gap to the upside, which took price action above support before collapsing below it. A farther breakdown into its long-term support zone between 6,386.75 and 6,633.70 cannot be ruled out. Traders should monitor for a move in this cryptocurrency pair below its 50.0 Fibonacci Retracement Fan Support Level, which is likely to result in the next wave of sell orders. You can learn more about a breakdown here.
BTC/USD Technical Trading Set-Up - Breakdown Extension Scenario
Short Entry @ 7,650.00
Take Profit @ 6,635.00
Stop Loss @ 7,950.00
Downside Potential: 101,500 pips
Upside Risk: 30,000 pips
Risk/Reward Ratio: 3.83
Should the Force Index complete a double breakout and cross above the 0 center-line, the BTC/USD is expected to reverse to the upside. While the long-term outlook for this cryptocurrency pair remains cautiously optimistic for the first half of 2020, a breakout above its resistance zone will require a fresh catalyst. Until one emerges, it is anticipated to reject a second breakout attempt.
BTC/USD Technical Trading Set-Up - Limited Breakout Scenario
Long Entry @ 8,100.00
Take Profit @ 8,400.00
Stop Loss @ 7,950.00
Upside Potential: 30,000 pips
Downside Risk: 15,000 pips
Risk/Reward Ratio: 2.00

