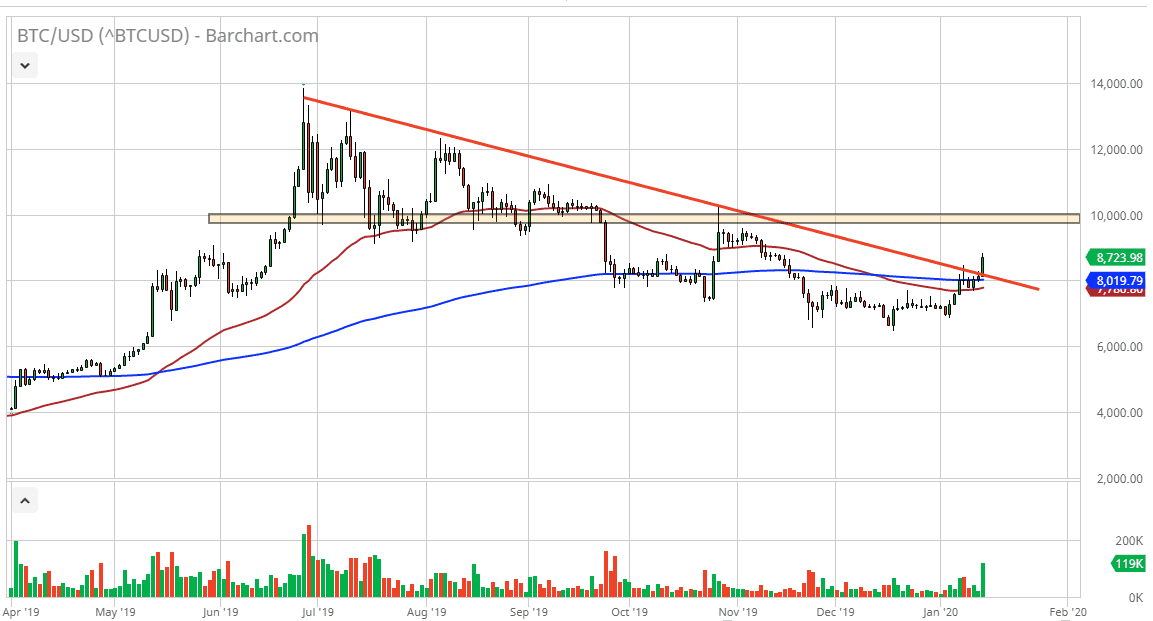
Bitcoin has had a very good session on Tuesday, breaking above the downtrend line that has been so prominent in this market. Because of this, it’s very likely that there is still momentum to the upside, and it should be noted that the spike in volume was of course a very bullish sign. From a technical analysis perspective, you want to see these types of breakouts accompanied by volume, because it shows conviction. There are plenty of people jumping into the market to take advantage of a move, so goes the theory.
Looking at the longer-term charts, the $10,000 level will more than likely be a massive resistance barrier. Whether we can break above there is a completely different question, so that for the time being is going to be considered to be the “ceiling.” It was significant support and resistance before, so unless something changes drastically, it’s very likely that it will continue to press back on any rally. If you are a short-term trader though, you can take advantage of this break out and try to aim towards that level. From a longer-term perspective, it needs to be closed above on at least the daily chart to be considered “broken.”
At this point, it should be noted that the $8700 level is offering a little bit of resistance, and I am not shy about starting to sell again on an exhaustive candlestick. However, the Tuesday candle is rather impressive and has enough volume to make it appear to be the real thing as far as a breakout is concerned. At this point, it’s very unlikely that this is a trend change, at least for the longer-term. It might be a short-term trend change, but there is a lot of noise floating around the $10,000 level that would take a significant amount of effort to break through. At this point, it comes down to your timeframe, but if you are a short-term trader you may be able to take advantage of that bullish move. Otherwise, you are simply on the sidelines waiting to see if this market falls somewhere between here and the $10,000 level which would be your “line in the sand.” A break above there obviously would change a lot of things but at this point we are still a bit of distance from getting to that level. Short-term bullish gives way to longer-term bearish.

