Australian economic data came in slightly better than expected and was just enough to stabilize the AUD/SGD inside of its support zone. Annualized inflationary pressures inched closer to the Reserve Bank of Australia’s target of 2.0%, consumer confidence remained stable, and a leading index showed a minor expansion. As Australia continues to struggle with the impact of devastating bush fires, the global spread of a coronavirus is threatening major supply chains. Singapore is likely to face a bigger disruption than Australia, adding to upside pressure in this currency pair.
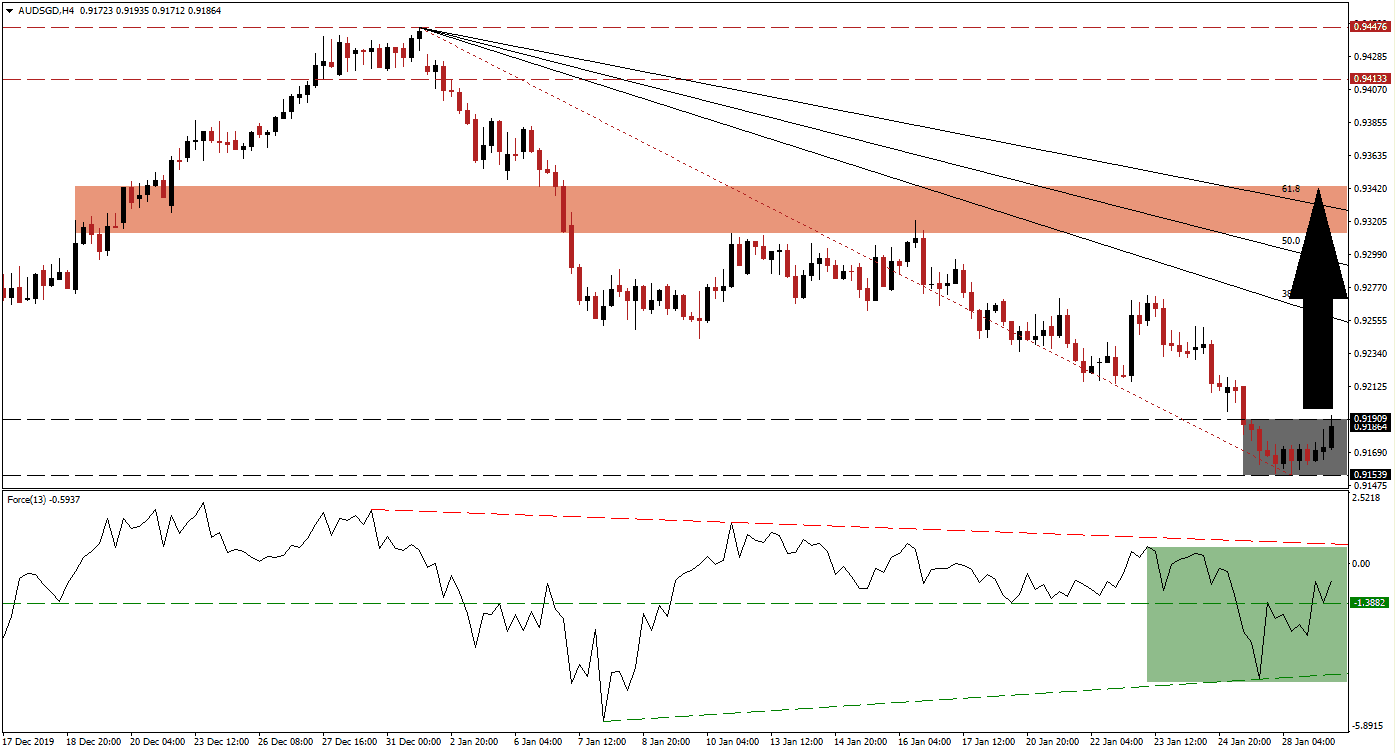
The Force Index, a next-generation technical indicator, offered the first sign that the contraction in the AUD/SGD is nearing its end. As price action extended its slide to a lower low, a higher low was set by the Force Index, allowing for the formation of a positive divergence. This technical indicator also converted its horizontal resistance level into support, as marked by the green rectangle, and is now anticipated to cross above the 0 center-line. Bulls will then be placed in charge of price action, leading a recovery. You can learn more about the Force Index here.
Adding to bullish developments is the move in this currency pair above its Fibonacci Retracement Fan trendline, which materialized inside of its support zone. This zone is located between 0.91539 and 0.91909, as marked by the grey rectangle. A breakout is favored to initiate a short-covering rally, closing the gap between the AUD/SGD and its descending 38.2 Fibonacci Retracement Fan Resistance Level. You can learn more about a short-covering rally here.
Forex traders are advised to monitor the intra-day low of 0.92142, the low of a previous pause in the corrective phase of the AUD/SGD. It additionally marks the last instance this currency pair bounced off of its Fibonacci Retracement Fan trendline, before sliding to a lower low. A move above this level is likely to result in the next wave of net buy orders, which will push price action into its short-term resistance zone located between 0.93124 and 0.93437, as marked by the red rectangle. An extension of the breakout sequence remains possible, but a fresh catalyst is necessary.
AUD/SGD Technical Trading Set-Up - Short-Covering Scenario
- Long Entry @ 0.91850
- Take Profit @ 0.93400
- Stop Loss @ 0.91400
- Upside Potential: 155 pips
- Downside Risk: 45 pips
- Risk/Reward Ratio: 3.44
In case of a breakdown in the Force Index below its ascending support level, the AUD/SGD may be pressured into a breakdown. Due to the long-term fundamental outlook, supported by the technical picture, the downside potential remains limited to its next support zone located between 0.90030 and 0.90570. This dates back to 2001 and marks an excellent buying opportunity in this currency pair.
AUD/SGD Technical Trading Set-Up - Limited Breakdown Scenario
- Short Entry @ 0.91100
- Take Profit @ 0.90350
- Stop Loss @ 0.91400
- Downside Potential: 75 pips
- Upside Risk: 30 pips
- Risk/Reward Ratio: 2.50

