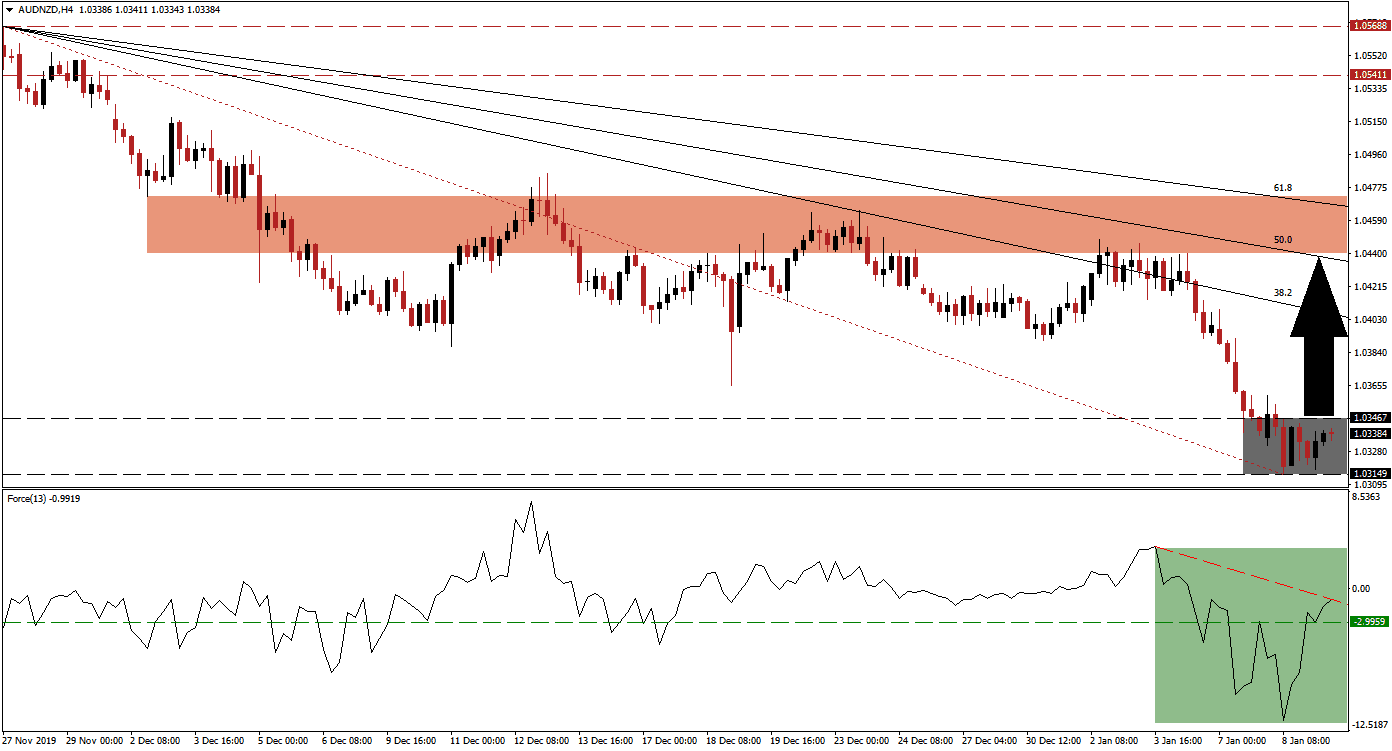
Tensions between the US and Iran appear to be easing for now, and traders will be able to pay closer attention to fundamentals. This allowed the sell-off in the AUD/NZD to pause inside of its support zone. Australian economic data showed a rebound in exports for November, while imports posted a contraction. The trade surplus exceeded estimates as a result, but the economy is faced with headwinds that can partially be blamed on the fires season ravaging the country. Estimates put the economic damage around $20 billion, and the Reserve Bank of Australia may cut interest rates in response.
The Force Index, a next-generation technical indicator, confirmed the lower low in the AUD/NZD with a lower low of its own. Bullish momentum recovered quickly as price action paused at its support zone. The Force Index converted its horizontal resistance level back into support, as marked by the green rectangle. This technical indicator has reached its descending resistance level, from where a breakout is anticipated. It will additionally take it into positive territory and place bulls in charge of this currency pair.
After price action converted its short-term support zone into resistance, a series of lower highs have kept the corrective phase intact. Due to the increase in bullish momentum, the AUD/NZD is favored to complete a breakout above its support zone located between 1.03149 and 1.03467, as marked by the grey rectangle. This is likely to initiate a short-covering rally, which will close the gap to its descending 38.2 Fibonacci Retracement Fan Resistance Level. You can read more about a short-covering rally here.
Forex traders are advised to monitor the intra-day low of 1.03657. This is the reaction low following a breakdown in this currency pair below its Fibonacci Retracement Fan trendline, which was reversed into its 38.2 Fibonacci Retracement Fan Resistance Level. A move above this low is favored to result in the addition of new net long positions. The AUD/NZD should advance into its 50.0 Fibonacci Retracement Fan Resistance Level, positions just below its short-term resistance zone. This zone is located between 1.04401 and 1.04722, as marked by the red rectangle. A breakout will require a fresh fundamental catalyst.
AUD/NZD Technical Trading Set-Up - Short-Covering Scenario
Long Entry @ 1.03350
Take Profit @ 1.04350
Stop Loss @ 1.03100
Upside Potential: 100 pips
Downside Risk: 25 pips
Risk/Reward Ratio: 4.00
In the event of a reversal in the Force Index, inspired by its descending resistance level, the AUD/NZD may attempt a breakdown. Risk of an RBA interest rate cut counter the extremely oversold state of this currency, but the long-term fundamental outlook remains cautiously bullish, while short-term technical developments suggest a reversal. The downside potential remains limited, and the next support zone awaits price action between 1.02120 and 1.02373.
AUD/NZD Technical Trading Set-Up - Breakdown Scenario
Short Entry @ 1.02900
Take Profit @ 1.02150
Stop Loss @ 1.03200
Downside Potential: 75 pips
Upside Risk: 30 pips
Risk/Reward Ratio: 2.50

