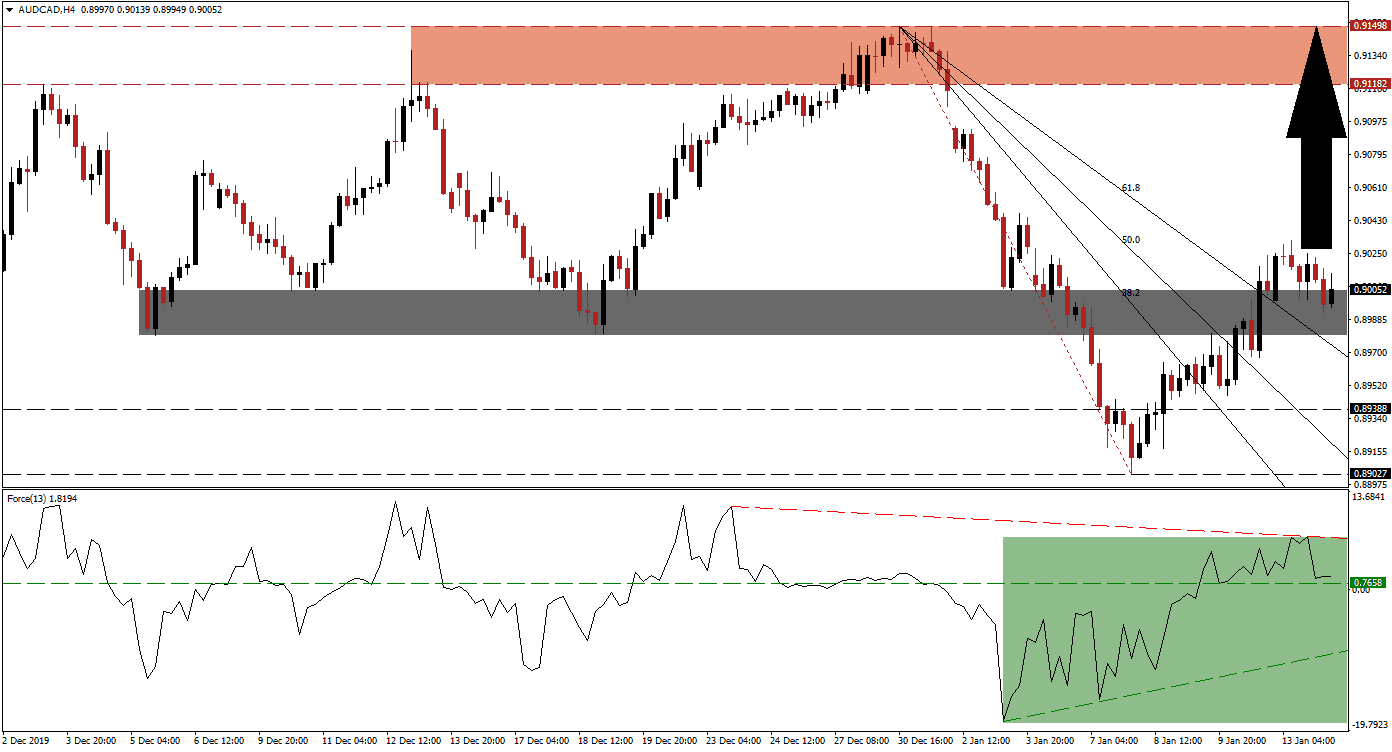
Chinese trade data for December showed a sharp increase in exports, but this is likely due to demand from the holiday shopping season. Imports surged as well, with the trade surplus exceeding expectations. The Australian Dollar remained in its bullish trend, as the data provided a boost to sentiment. Since the Chinese Yuan is not effortlessly available for trading, the Australian Dollar became the number one proxy currency for it, due to the country's dependence on China. The AUD/CAD drifted back into its short-term support zone, but uptrend remains intact.
The Force Index, a next-generation technical indicator, shows the steady advance in bullish momentum as price action recovered from its long-term support zone. The Force Index retreated slightly from its current peak, as this currency pair halted its advance, but remains above its horizontal support level in positive territory. A new push higher is favored to take this technical indicator above its shallow descending resistance level. Its ascending support level is raising the floor for short-term reversals in the AUD/CAD, as marked by the green rectangle. You can learn more about the Force Index here.
After US-Iranian tensions rose, this currency pair entered a strong corrective phase, which resulted in a steep Fibonacci Retracement Fan sequence. A breakout sequence elevated the AUD/CAD above the 61.8 Fibonacci Retracement Fan Resistance Level, adding to bullish developments. This allowed for a conversion of its short-term resistance zone into support, from where price action is anticipated to extend its advance. The converted short-term support zone is located between 0.89796 and 0.90045, as marked by the grey rectangle.
Following the breakout in the AUD/CAD above its entire Fibonacci Retracement Fan sequence, the path is clear for an extended advance. The next long-term resistance zone is located between 0.91182 and 0.91498, as marked by the red rectangle. Volatility may increase moving forward, and the Australian and Canadian economies share three critical similarities. Both are heavily exposed to the commodity sector, face a central bank open to an interest rate cut, and are governed by leadership with shrinking support. Exposure to China favors more long-term upside for this currency pair.
AUD/CAD Technical Trading Set-Up - Breakout Extension Scenario
Long Entry @ 0.90000
Take Profit @ 0.91450
Stop Loss @ 0.89700
Upside Potential: 145 pips
Downside Risk: 30 pips
Risk/Reward Ratio: 4.83
In the event of a breakdown in the Force Index below its ascending support level, the AUD/CAD is likely to follow through with one below its short-term support zone. Due to the dominant bullish fundamental outlook, the downside is limited to its long-term support zone located between 0.89027 and 0.89388. This will represent an outstanding buying opportunity in this currency pair.
AUD/CAD Technical Trading Set-Up - Limited Breakdown Scenario
Short Entry @ 0.89500
Take Profit @ 0.89100
Stop Loss @ 0.89700
Downside Potential: 40 pips
Upside Risk: 20 pips
Risk/Reward Ratio: 2.00

