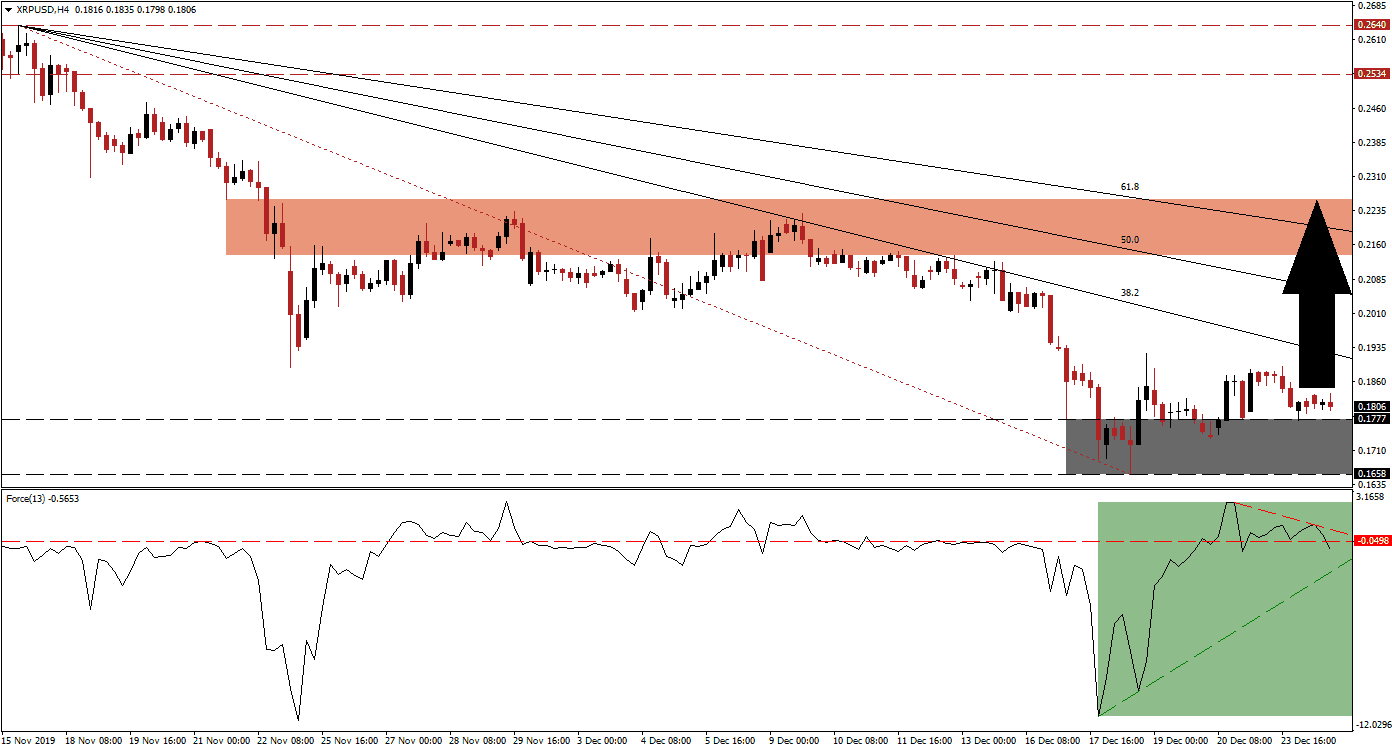
Ripple, the entity controlling the XRP token, secured a C-Round of funding worth $200 million. This boosted valuation to $10 billion, creating one of Silicon Valley’s biggest private start-ups. As Ripple’s valuation continues to rise, the XRP/USD logged a terrible performance for 2019. Analysts are perplexed over the disconnect, and traders manage to ignore the fundamental potential of this cryptocurrency pair, which core enthusiasts fail to embrace due to its openness towards regulation. Price action maintained its latest breakout above its support zone, halting the value erosion.
The Force Index, a next-generation technical indicator, points towards a sharp momentum recovery after the XRP/USD descended into its support zone. The Force Index initially pushed above its horizontal resistance level, but failed to extend, and reversed below it once again. A descending resistance level materialized, adding to downside pressure, as marked by the green rectangle. This technical indicator re-entered negative conditions, but the ascending support level us favored to guide it above the 0 center-line and place bulls in control. You can learn more about the Force Index here.
This cryptocurrency pair remains above its support zone located between 0.1658 and 0.1777, as marked by the grey rectangle. Ripple has working relationships with over 300 financial institutions, continues heavy investments into its infrastructure, but has failed to illustrate a convincing change in the financial system it envisions to modernize. Patient investors are expected to be rewarded, as the outlook remains increasingly bullish. The XRP/USD is anticipated to spike higher off of the top range of its support zone, and push through its descending 38.2 Fibonacci Retracement Fan Resistance Level.
2020 will represent a key year for Ripple, and the XRP/USD is anticipated to capitalize on the bullish fundamentals. A breakout above its 38.2 Fibonacci Retracement Fan Resistance Level should take it into its short-term resistance zone located between 0.2137 and 0.2260, as marked by the red rectangle. The 61.8 Fibonacci Retracement Fan Resistance Level is currently nestled inside this zone, posing the first major resistance level for the anticipated price action recovery. A breakout is possible, which can extend an advance into its long-term resistance zone located between 0.2534 and 0.2640.
XRP/USD Technical Trading Set-Up - Breakout Extension Scenario
Long Entry @ 0.1800
Take Profit @ 0.2260
Stop Loss @ 0.1650
Upside Potential: 460 pips
Downside Risk: 150 pips
Risk/Reward Ratio: 3.07
A breakdown in the Force Index below its ascending support level may lead the XRP/USD into its support zone. While a breakdown cannot be ruled out, the downside potential remains limited to its next support zone between 0.1270 and 0.1481. This will mark an outstanding long-term buying opportunity for patient investors. A sustained price action recovery is favored to close the extensive gap between price action and fundamental developments.
XRP/USD Technical Trading Set-Up - Unlikely Breakdown Scenario
Short Entry @ 0.1600
Take Profit @ 0.1350
Stop Loss @ 0.1725
Downside Potential: 250 pips
Upside Risk: 125 pips
Risk/Reward Ratio: 2.00

