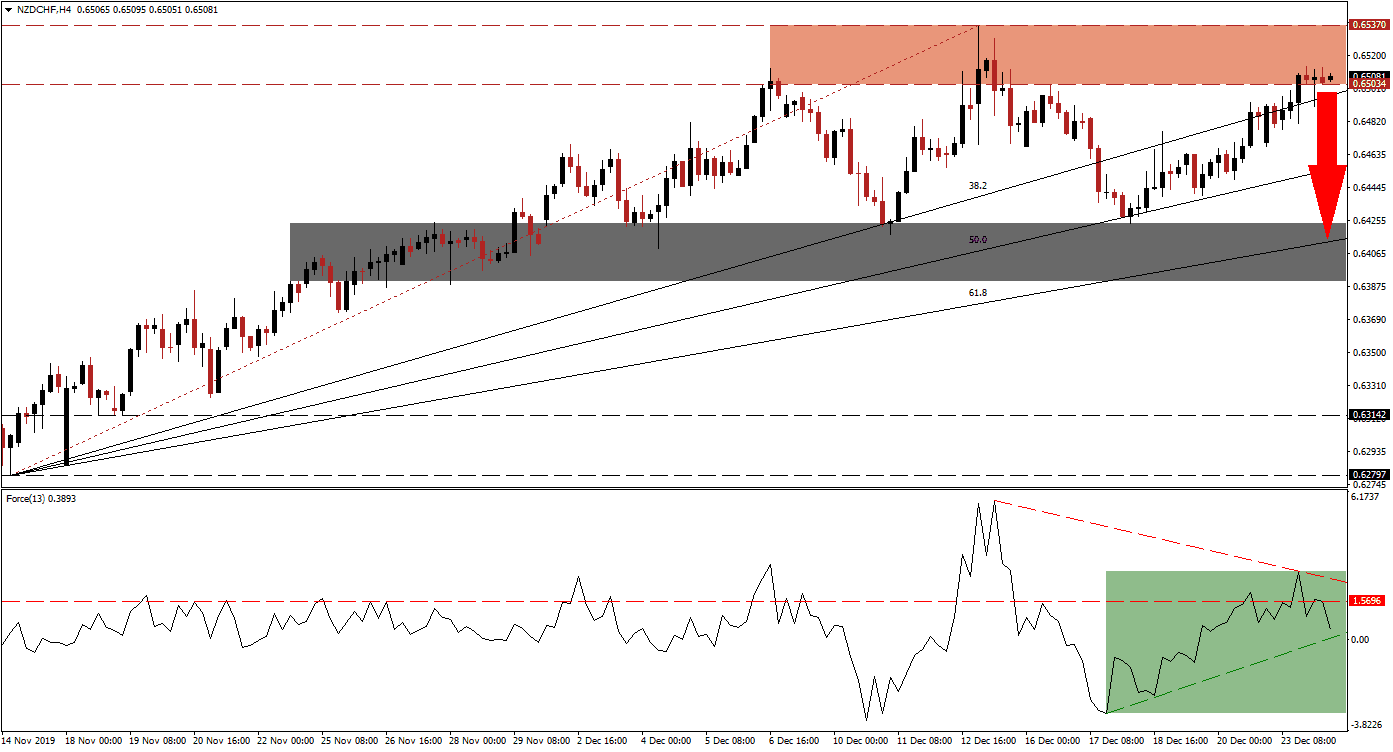
Bullish momentum is fading after the NZD/CHF advanced into its resistance zone. Economic data out of New Zealand points towards recovery, and the outlook remains bright in a challenging 2020. The Swiss Franc is expected to remain in demand due to its safe-haven status. This is likely to create a volatile trading environment for this currency pair, as both currencies are anticipated to receive a fundamental boost. A counter-trend sell-off is favored as forex traders engage in year-end portfolio adjustments. You can learn more about a resistance zone here.
The Force Index, a next-generation technical indicator, suggests a breakdown in the NZD/CHF as bearish momentum is on the rise. The Force Index initially advanced and confirmed the upside in this currency pair. After this currency pair entered its resistance zone, this technical indicator contracted below its horizontal support level, turning it into resistance. The lower high resulted in the emergence of a descending resistance level, as marked by the green rectangle. The Force Index is now favored to push below its ascending support level, and into negative conditions, placing bears in charge of this currency pair.
Price action was rejected by the resistance zone on two previous occasions, and another breakdown is anticipated. The resistance zone is located between 0.65034 and 0.65370, as marked by the red rectangle. A breakdown will additionally take this currency pair below its ascending 38.2 Fibonacci Retracement Fan Support Level, converting it into resistance. This is likely to initiate a profit-taking sell-off in the NZD/CHF and add to the pending price action reversal. You can learn more about the Fibonacci Retracement Fan here.
Forex traders are advised to monitor the Force Index, as a move below the 0 center-line is anticipated to lead this currency pair into a double breakdown. The next short-term support zone is located between 0.63907 and 0.64240, as marked by the grey rectangle, with the 61.8 Fibonacci Retracement Fan Support Level crossing through this zone. Price action was able to reverse to the upside off of this support zone, during three corrections, which is favored to mark the end of the expected price action reversal in the NZD/CHF.
NZD/CHF Technical Trading Set-Up - Price Action Reversal Scenario
Short Entry @ 0.65050
Take Profit @ 0.64000
Stop Loss @ 0.65400
Downside Potential: 105 pips
Upside Risk: 35 pips
Risk/Reward Ratio: 3.00
A recovery in the Force Index above its descending resistance level can pressure the NZD/CHF into a breakout attempt. While the long-term fundamental outlook remains bullish for this currency pair, the technical picture favors a short-term corrective phase. The next resistance zone, following a sustained breakout, is located between 0.66291 and 0.66692. More upside is possible but will require a fresh catalyst.
NZD/CHF Technical Trading Set-Up - Breakout Scenario
Long Entry @ 0.65700
Take Profit @ 0.70200
Stop Loss @ 0.65350
Upside Potential: 95 pips
Downside Risk: 35 pips
Risk/Reward Ratio: 2.71

