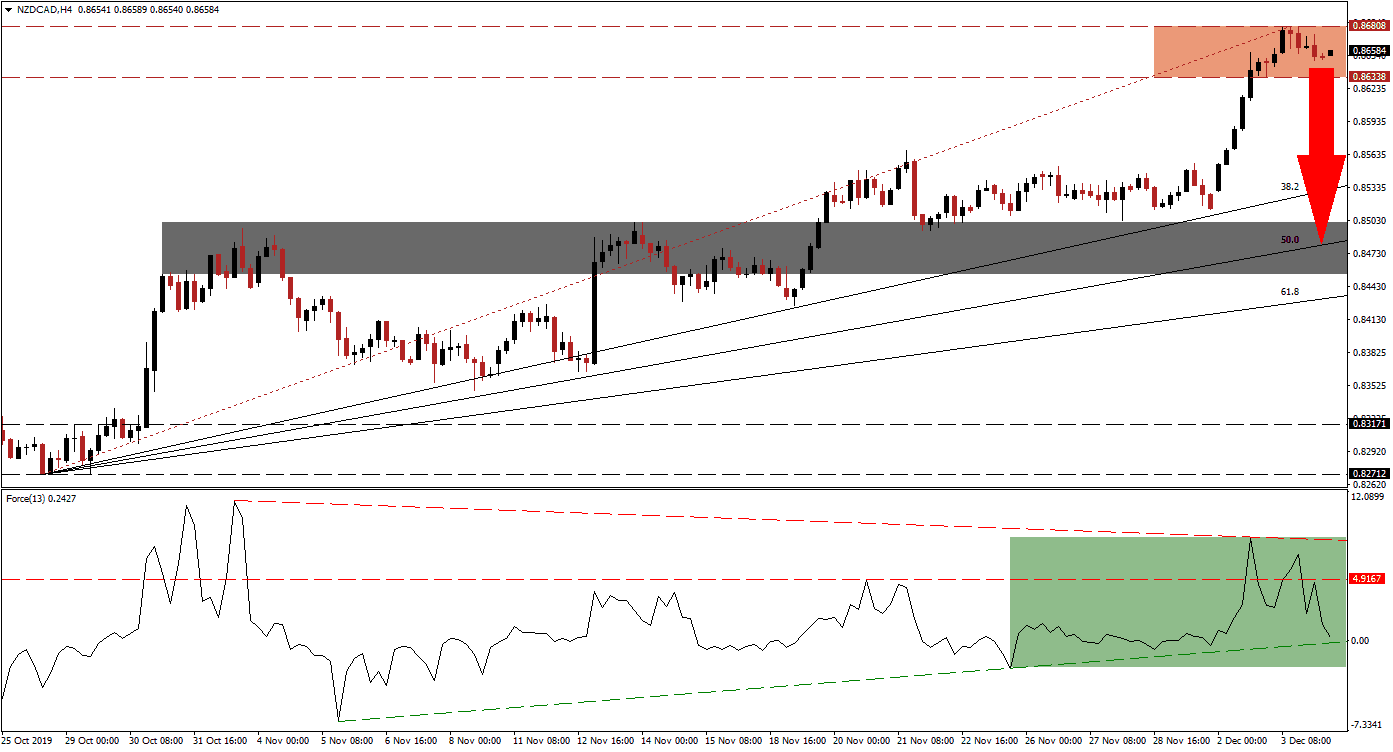
New Zealand reported an increase in house prices as well as in commodity prices which prevented a breakdown in the NZD/CAD to materialize. Price action remains inside its resistance zone, but bearish momentum started to accelerate. The Bank of Canada interest rate announcement may provide the fundamental catalysts for a price action reversal, depending on the forward guidance issued. A breakdown in this currency pair below its resistance zone is expected to close the gap between price action and its ascending 38.2 Fibonacci Retracement Fan Support Level.
The Force Index, a next-generation technical indicator, shows the collapse in bullish momentum that started before the NZD/CAD reached its resistance zone. A negative divergence formed as a result and the Force Index dropped below its horizontal support level, converting it into resistance. This technical indicator has now approached its ascending support level, as marked by the green rectangle. A breakdown is anticipated to follow, place the Force Index into negative conditions, and allow bears to lead price action to more downside. You can learn more about the Force Index here.
A breakdown in this currency pair below its resistance zone, located between 0.86338 and 0.86808 as marked by the red rectangle, is anticipated to lead to a profit-taking sell-off. The New Zealand Dollar and the Canadian Dollar are both commodity currencies and impacted by the gyrations in the sector. Canada is more exposed to hard commodities while New Zealand is geared towards soft commodities. Given the rise in bearish momentum and the presence of a negative divergence, the NZD/CAD is expected to enter a corrective phase.
Given the sharp advance, after this currency pair approached its 38.2 Fibonacci Retracement Fan Support Level, a breakdown will not face its first support until retracing back down to the same level. Another bearish development occurred after this currency pair moved below its Fibonacci Retracement Fan trendline. The price action reversal may extend into its next short-term support zone located between 0.84539 and 0.85017 as marked by the grey rectangle; the 50.0 Fibonacci Retracement Fan Support Level is passing through this zone. Such a move will keep the long-term uptrend in the NZD/CAD intact. You can learn more about a support zone here.
NZD/CAD Technical Trading Set-Up - Breakdown Scenario
Short Entry @ 0.86550
Take Profit @ 0.84800
Stop Loss @ 0.87100
Downside Potential: 175 pips
Upside Risk: 55 pips
Risk/Reward Ratio: 3.18
Should the Force Index reverse to the upside and push above its descending resistance level, the NZD/CAD could pressure for a breakout. The long-term fundamental outlook favors an extension in the uptrend as New Zealand has more positive drivers behind it than Canada, but the short-term technical outlook remains bearish. This currency pair will face its next resistance zone between 0.88538 and 0.89189.
NZD/CAD Technical Trading Set-Up - Breakout Scenario
Long Entry @ 0.87500
Take Profit @ 0.88850
Stop Loss @ 0.87000
Upside Potential: 135 pips
Downside Risk: 50 pips
Risk/Reward Ratio: 2.70

