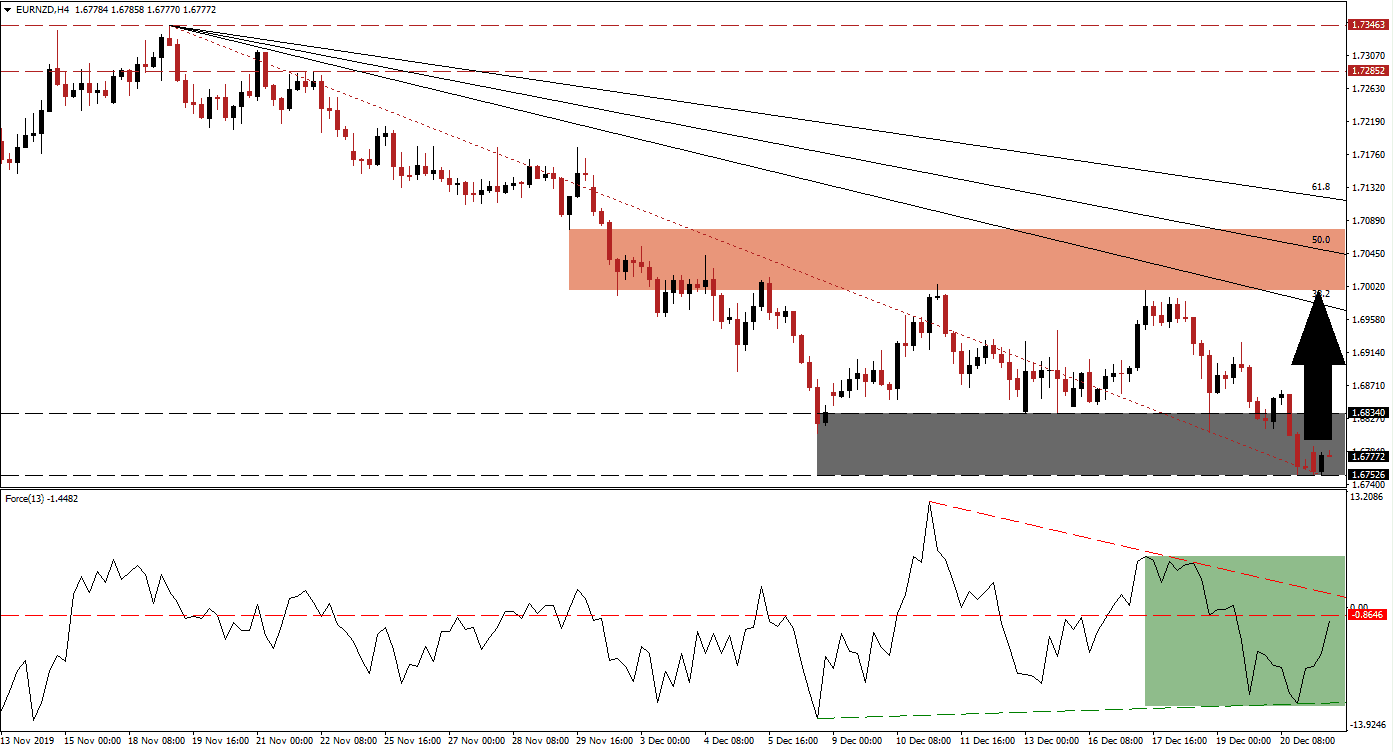
Germany continues to resist calls by the European Central Bank to increase fiscal spending. The ECB has argued for governments to help the central bank’s quantitative easing program by stimulating economies through fiscal spending. Germany disagrees and hopes to ride the US-China trade truce higher while speculating on a soft Brexit. This combination of ill-advised viewpoints helped pressure the Euro to the downside. The EUR/NZD has now reached its support zone, and bullish momentum is on the rise, increasing breakout risks for this currency pair.
The Force Index, a next-generation technical indicator, contracted together with this currency pair before sharply reversing direction after the EUR/NZD entered its support zone. This resulted in a higher low as compared to the previous descend, and a positive divergence formed. The Force Index is now on the verge of pushing above its horizontal resistance level, as marked by the green rectangle. A breakout above its descending resistance level is favored to follow, placing this technical indicator in positive territory with bulls in control of price action. You can learn more about the Force Index here.
While bullish momentum is expanding after the EUR/NZD descended into its support zone located between 1.67526 and 1.68340, as marked by the grey rectangle, the long-term bearish outlook remains intact. A breakout from current levels may result in a short-covering rally that will close the gap between price action and its descending 38.2 Fibonacci Retracement Fan Resistance Level. The New Zealand economy started to recover and is anticipated to accelerate in 2020, adding to fundamental bearish pressures in this currency pair.
Price action is favored to exhaust its upside potential at its short-term resistance zone located between 1.69960 and 1.70770, as marked by the red rectangle. The EUR/NZD was rejected four times by this zone, each resulting in a marginally lower high. The 50.0 Fibonacci Retracement Fan Resistance Level is currently moving through this zone and expected to keep downside pressure in this currency pair. Unless a fresh fundamental catalyst will change the existing dynamics, a short-covering rally is anticipated to lead to more long-term downside. You can learn more about a resistance zone here.
EUR/NZD Technical Trading Set-Up - Breakout Scenario
Long Entry @ 1.67750
Take Profit @ 1.70000
Stop Loss @ 1.67000
Upside Potential: 225 pips
Downside Risk: 75 pips
Risk/Reward Ratio: 3.00
A failure in the Force Index to extend its advance and reversal into its shallow ascending support level may lead to a breakdown attempt in the EUR/NZD. This will invalidate the expected short-covering rally, required to maintain the health and longevity of the long-term downtrend. The next support zone is located between 1.65263 and 1.65750, more downside is possible but will require a fresh catalyst.
EUR/NZD Technical Trading Set-Up - Breakdown Scenario
Short Entry @ 1.66550
Take Profit @ 1.65300
Stop Loss @ 1.67000
Downside Potential: 125 pips
Upside Risk: 45 pips
Risk/Reward Ratio: 2.78

