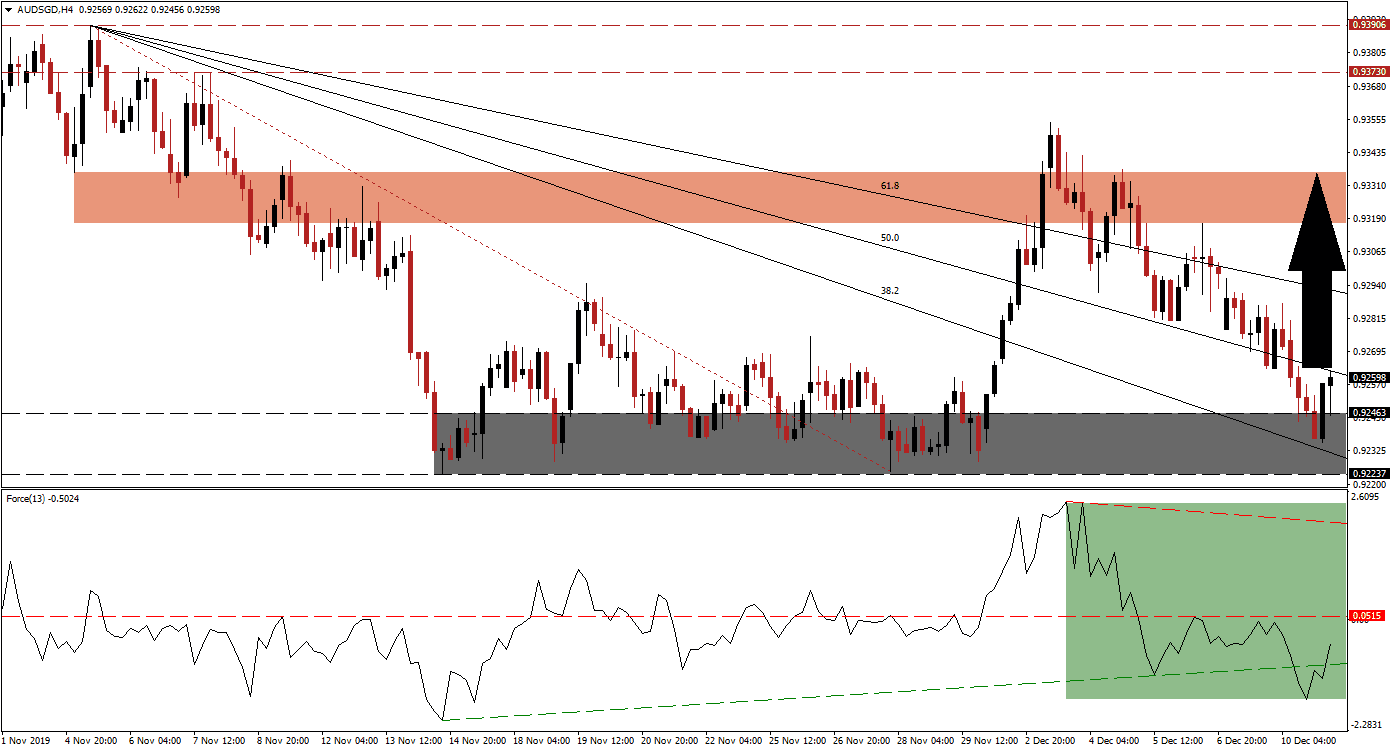
Consumer confidence decreased in Australia as the holiday shopping season started, but the AUD/SGD was able to recover. News about a possible delay in fresh tariffs between the US and China, which were supposed to be implemented on Sunday, lifted sentiment; the Australian Dollar remains the top Chinese Yuan proxy currency. Price action descended into its support zone, from where bullish momentum recovered. This currency pair has now pushed higher, and a breakout sequence is expected to elevate price action further to the upside. You can learn more about a support zone here.
The Force Index, a next-generation technical indicator, plunged after the AUD/SGD failed to maintain its breakout above its short-term resistance zone. The Force Index converted its horizontal support level into resistance, and after two failed breakout attempts extended the slide below its ascending support level. This indicator is now recovering from the descend, as marked by the green rectangle, and is expected to move back into positive territory, which will place bulls in charge of price action.
As this currency pair moved into its support zone located between 0.92237 and 0.92463, as marked by the grey rectangle, the descending 38.2 Fibonacci Retracement Fan Support Level provided the necessary technical catalyst for a recovery. The AUD/SGD is now faced with its 50.0 Fibonacci Retracement Fan Resistance Level, and with the build-up in bullish momentum, a breakout is anticipated to follow. Forex traders are advised to monitor the intra-day high of 0.92750, the peak of the initial move in price action above its Fibonacci Retracement Fan trendline; a move above this mark is likely to result in a short-covering rally.
Another key level to monitor is the 61.8 Fibonacci Retracement Fan Resistance Level, as a breakout will end the corrective phase, which already resulted in a higher low. The next short-term resistance zone is located between 0.93170 and 0.93361, as marked by the red rectangle, but more upside is possible. Volatility in the AUD/SGD is expected to remain elevated, as it is exposed to the US-China trade war, and protests in Hong Kong due to capital inflows into Singapore. Positive news flow regarding trade talks may elevate price action into its long-term resistance zone, located between 0.93730 and 0.93906. You can learn more about a breakout here.
AUD/SGD Technical Trading Set-Up - Breakout Extension Scenario
Long Entry @ 0.92600
Take Profit @ 0.93350
Stop Loss @ 0.92350
Upside Potential: 75 pips
Downside Risk: 25 pips
Risk/Reward Ratio: 3.00
In the event of a reversal in the Force Index below its ascending support level, the AUD/SGD may attempt a breakdown below its support zone. Given the long-term fundamental outlook, the downside potential remains limited to its next support zone located between 0.91290 and 0.91620; this dates back to 2001 and represents an excellent buying opportunity in this currency pair.
AUD/SGD Technical Trading Set-Up - Limited Breakdown Scenario
Short Entry @ 0.92100
Take Profit @ 0.91650
Stop Loss @ 0.92350
Downside Potential: 55 pips
Upside Risk: 25 pips
Risk/Reward Ratio: 2.20

