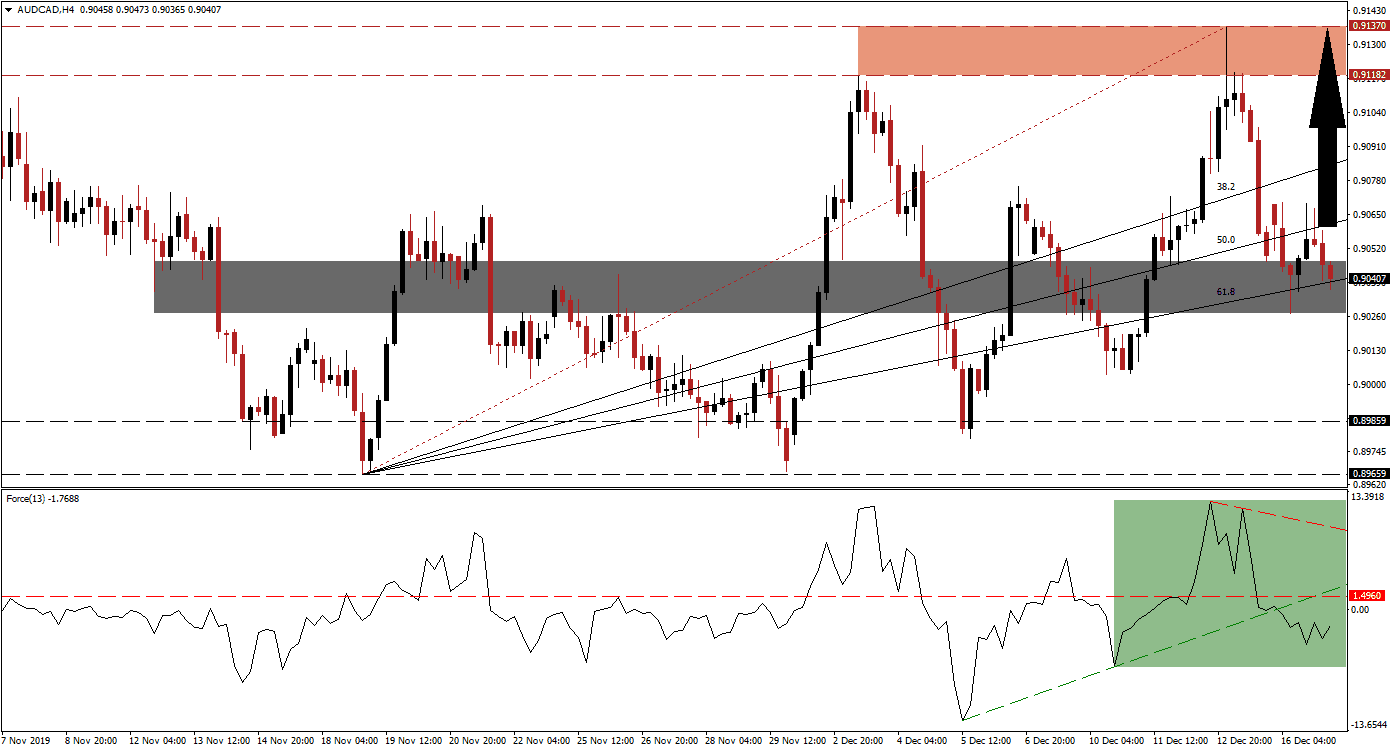
Dovish minutes released by the Reserve Bank of Australia highlighted concerns over weak wage growth and inflation targets. An interest rate cut in February remains on the table, which pressured the AUD/CAD into its short-term support zone. The Bank of Canada has not ruled out a 2020 interest rate cut as the global economy is cooling further. Bullish momentum is starting to stabilize, and while monetary easing out of both central banks remains an option, the long-term prospects for the Australian Dollar favor a renewed advance in this currency pair.
The Force Index, a next-generation technical indicator, descended after price action moved into its resistance zone; a second attempt to extend the advance with a bullish surge resulted in a lower high, and a descending resistance level emerged. The Force Index plunged through its horizontal support level, converting it into resistance, which additionally took it below its ascending support level. This technical indicator is now stabilizing in negative conditions, as marked by the green rectangle, and a push into positive territory is likely to precede an advance in the AUD/CAD. You can learn more about the Force Index here.
This currency pair has now reached its short-term support zone located between 0.90275 and 0.90472, as marked by the grey rectangle. The ascending 61.8 Fibonacci Retracement Fan Support Level is currently passing through this zone, and the Fibonacci Retracement Fan sequence is anticipated to guide price action to the upside. A breakout in the AUD/CAD above its short-term resistance zone is additionally expected to initiate a short-covering rally and provide more upside momentum.
Forex traders are advised to monitor the intra-day high of 0.90694, the peak of a failed breakout attempt; a move above this level is likely to result in the addition of new net long positions in the AUD/CAD. This should clear the path for this currency pair to ascend into its resistance zone located between 0.91182 and 0.91370, as marked by the red rectangle. Today’s manufacturing sales out of Canada may provide a short-term fundamental catalyst for price action. You can learn more about a breakout here.
AUD/CAD Technical Trading Set-Up - Breakout Scenario
Long Entry @ 0.90400
Take Profit @ 0.91350
Stop Loss @ 0.90150
Upside Potential: 95 pips
Downside Risk: 25 pips
Risk/Reward Ratio: 3.80
In case of a failed breakout attempt in the Force Index above its ascending support level, the AUD/CAD could attempt to push for more downside. Given the current fundamental outlook for this currency pair, the downside potential remains limited to its next long-term support zone located between 0.89659 and 0.89859. This should be viewed as a good buying opportunity.
AUD/CAD Technical Trading Set-Up - Limited Breakdown Scenario
Short Entry @ 0.90000
Take Profit @ 0.89700
Stop Loss @ 0.90150
Downside Potential: 30 pips
Upside Risk: 15 pips
Risk/Reward Ratio: 2.00

