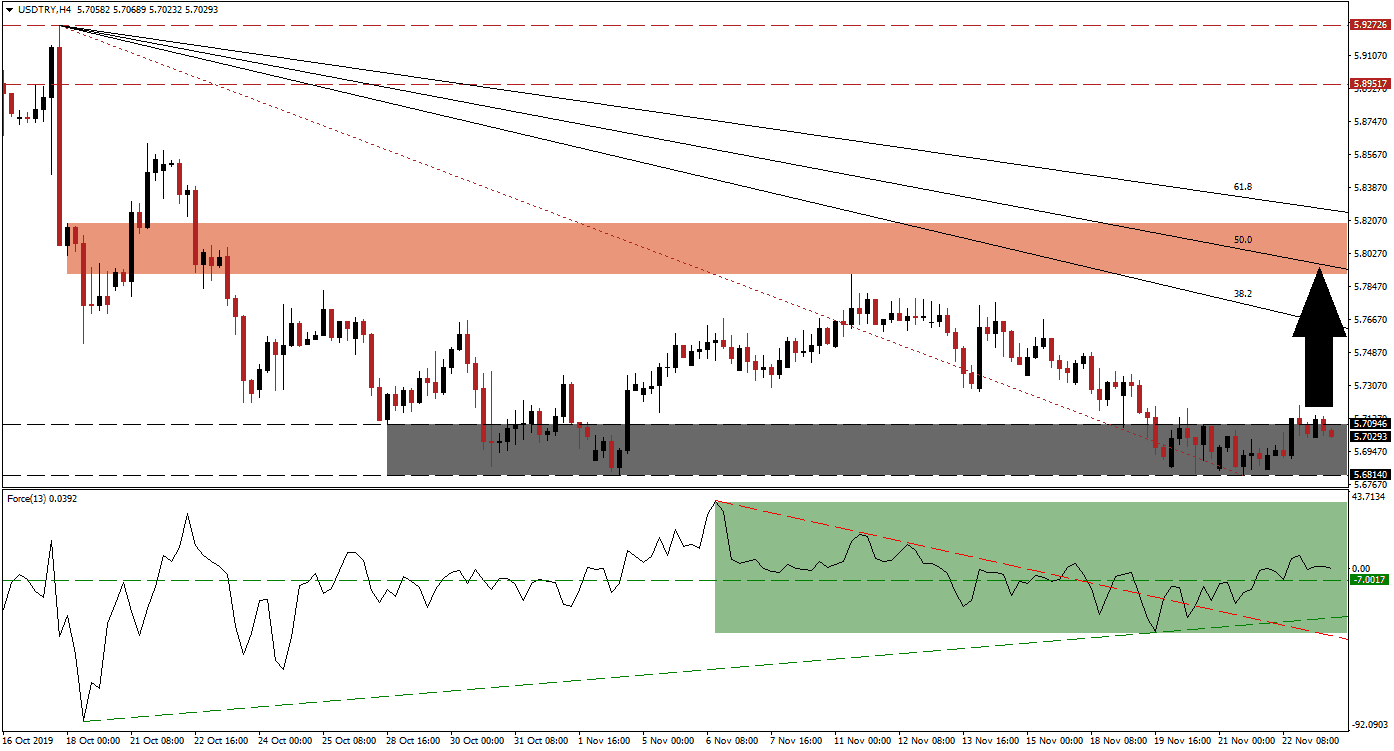
Downside momentum is exhausted after the USD/TRY reached its support zone. While the long-term outlook remains bearish, a short-term counter-trend advance is expected to follow the increase in bullish pressures. Turkey is in the process of finalizing an economic partnership deal that could take effect in 2020. At a time the US is fighting trade wars and disputes, Turkey is expanding its partnerships. This currency pair is well-positioned to advance further and a short-covering rally will give the downtrend the pause it needs to ensure its longevity. You can read more about a short-covering rally here.
The Force Index, a next-generation technical indicator, points towards the increase in bearish momentum with a breakout above its horizontal resistance level as marked by the green rectangle. The breakout has elevated the Force Index into positive conditions and placed bulls in charge of price action, a breakout in the USD/TRY is expected to follow. Volatility is likely to remain elevated as this currency pair attempts to sustain a breakout, but as long as this technical indicator remains above its ascending support level the short-term bullish bias remains dominant.
Forex traders are now advised to monitor the intra-day high of 5.71999 which marks the peak of a failed breakout attempt in the USD/TRY above its support zone, located between 5.68140 and 5.70946 as marked by the grey rectangle. A second attempt is expected to maintain the breakout, due to the supporting increase in bullish momentum, and close the gap between this currency pair and its descending 38.2 Fibonacci Retracement Fan Resistance Level. You can learn more about the Fibonacci Retracement Fan here.
With the increase in uncertainty about a meaningful trade deal between the US and China, coupled with a US central bank that is expected to expand its balance sheet, the US Dollar may be in for a prolonged period of selling pressure. The slow grind of impeachment proceedings against US President Trump has added more noise to the market. Upside potential from the anticipated advance remains limited to the next short-term resistance zone that awaits the USD/TRY between 5.79131 and 5.81893 as marked by the red rectangle. The 50.0 Fibonacci Retracement Fan Resistance Level is on the verge of crossing below this zone.
USD/TRY Technical Trading Set-Up - Breakout Scenario
⦁ Long Entry @ 5.70250
⦁ Take Profit @ 5.79500
⦁ Stop Loss @ 5.68000
⦁ Upside Potential: 925 pips
⦁ Downside Risk: 225 pips
⦁ Risk/Reward Ratio: 4.11
In case of a breakdown in the Force Index below its horizontal as well as ascending support levels, the USD/TRY could follow through with a breakdown below its support zone and reignite the sell-off. The descending resistance level in the Force Index may pull this technical indicator lower, leading the sell-off. A sustained breakdown may take price action into its next support zone, located between 5.58590 and 5.63080.
USD/TRY Technical Trading Set-Up - Breakdown Scenario
⦁ Short Entry @ 5.66500
⦁ Take Profit @ 5.58750
⦁ Stop Loss @ 5.69250
⦁ Downside Potential: 775 pips
⦁ Upside Risk: 275 pips
⦁ Risk/Reward Ratio: 2.82

