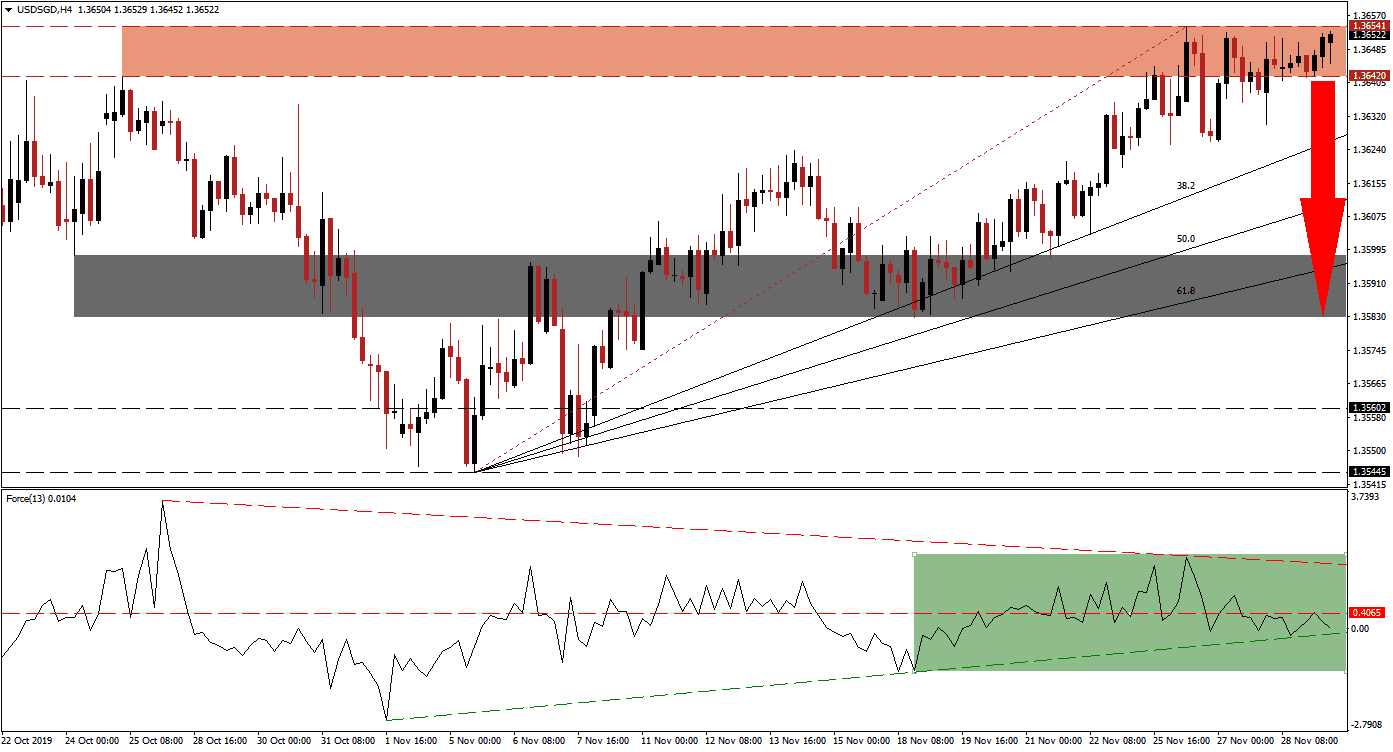
Despite better-than-expected economic data out of Singapore, the Singapore Dollar remains depressed. The positive impact of capital inflows from Hong Kong is fading and may have already peaked. While the USD/SGD ascended into its resistance zone, bearish momentum started to expand and is now expected to force a breakdown in this currency pair. The US Dollar may come under additional downside pressure as consumer confidence has contracted into the holiday shopping season as economic reports show a slowing economy. The sum of all bearish indicators points towards a breakdown and price action reversal.
The Force Index, a next-generation technical indicator, reversed after reaching its peak before a failed breakdown attempt in the USD/SGD. This resulted in the formation of a descending resistance level and the Force Index completed a breakdown below its horizontal support level, turning it into resistance as marked by the green rectangle. This technical indicator is now anticipated to push through its ascending support level which is expected to lead price action into a sustained breakdown below its resistance zone. It would additionally take the Force Index into negative conditions and place bears in charge of this currency pair. You can learn more about the Force Index here.
Another bearish development materialized after price action moved below its Fibonacci Retracement Fan trendline. A breakdown in the USD/SGD below its resistance zone, located between 1.36420 and 1.36541 as marked by the red rectangle, is expected to close the gap to its ascending 38.2 Fibonacci Retracement Fan Support Level. Forex traders are advised to monitor the intra-day low of 1.36259, the low of a failed breakdown attempt. Should this currency pair maintain a sustained push below this level, a profit-taking sell-off may follow and fuel more downside.
Following a breakdown in this currency pair below its 38.2 Fibonacci Retracement Fan Support Level, which would turn it into resistance, the USD/SGD will face its next support level at its short-term support zone located between 1.35827 and 1.35979 as marked by the grey rectangle. The 61.8 Fibonacci Retracement Fan Support Level is presently moving across this zone, but given fundamental developments, a further breakdown cannot be excluded. The next long-term support zone awaits this currency pair between 1.35445 and 1.35602. You can learn more about a support zone here.
USD/SGD Technical Trading Set-Up - Breakdown Scenario
⦁ Short Entry @ 1.36500
⦁ Take Profit @ 1.35850
⦁ Stop Loss @ 1.36700
⦁ Downside Potential: 65 pips
⦁ Upside Risk: 20 pips
⦁ Risk/Reward Ratio: 3.25
In case of a breakout in the Force Index above its descending resistance level, the USD/SGD could follow through with a breakout of its own. Without a fresh fundamental catalyst, any breakout is unlikely to be sustained and the next resistance zone is located between 1.37189 and 1.37643. Forex traders should take advantage of a limited breakout as it will represent an excellent short-selling opportunity.
USD/SGD Technical Trading Set-Up - Limited Breakout Scenario
⦁ Long Entry @ 1.36900
⦁ Take Profit @ 1.37350
⦁ Stop Loss @ 1.36700
⦁ Upside Potential: 45 pips
⦁ Downside Risk: 20 pips
⦁ Risk/Reward Ratio: 2.25

