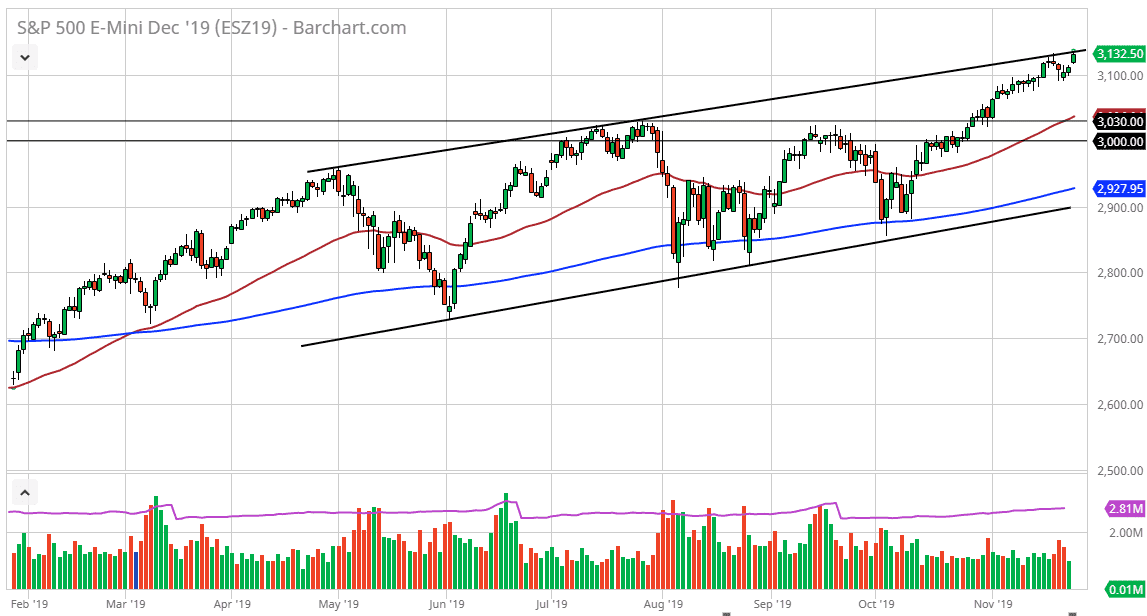
The S&P 500 has gapped higher to kick off the week on Monday, slamming into the top of the uptrend and channel. This is a bullish sign, but we are also in the wrong time of year to expect a lot of volume, at least this week. This is especially true considering that the Thanksgiving Day celebrations are on Thursday, and therefore it’s likely that the volume will completely disappear in the next 24 hours. For those you outside the United States, it should be noted that most trading will occur on Monday and Tuesday, with even lighter volume on Wednesday. Thursday the markets will be closed, although the electronic E-mini contract will be trading. That being said, the market will go back to “normal” on Friday, but quite frankly there will be much in the way of volume either. It’s quite common for Americans to take off Wednesday, Thursday and Friday from work. Traders are going to be no different.
Looking at this chart, I would love to see this market reach down towards the 50 day EMA, which is closer to the 3030 handle. There is a significant amount of support that extends down to the 3000 handle, and therefore I think that’s about as far as we can drop. While that would be a significant pullback, it would simply be a pullback to the top of the ascending triangle underneath. The ascending triangle underneath suggested that we were going to go towards the 3200 level, and therefore that is my target by the end of the year. That doesn’t necessarily mean that we have to get there today, and I think a short-term pullback makes a lot of sense because we have been a bit parabolic.
This will probably have something to do with a US/China trade war headline, which will then be ignored given enough time. That being said, if we do get a good headline, then it’s likely that this market could go towards at 3020 level rather quickly. In general, I am bullish, but I recognize that we need to find a bit of value in order to take advantage of. After all, the S&P 500 E-mini contract is no different than any other asset, if you want to buy it when it is “cheap.” It’s difficult to imagine a scenario where we break down below 3000, but if we were then the 200 day EMA would be the next support target.

