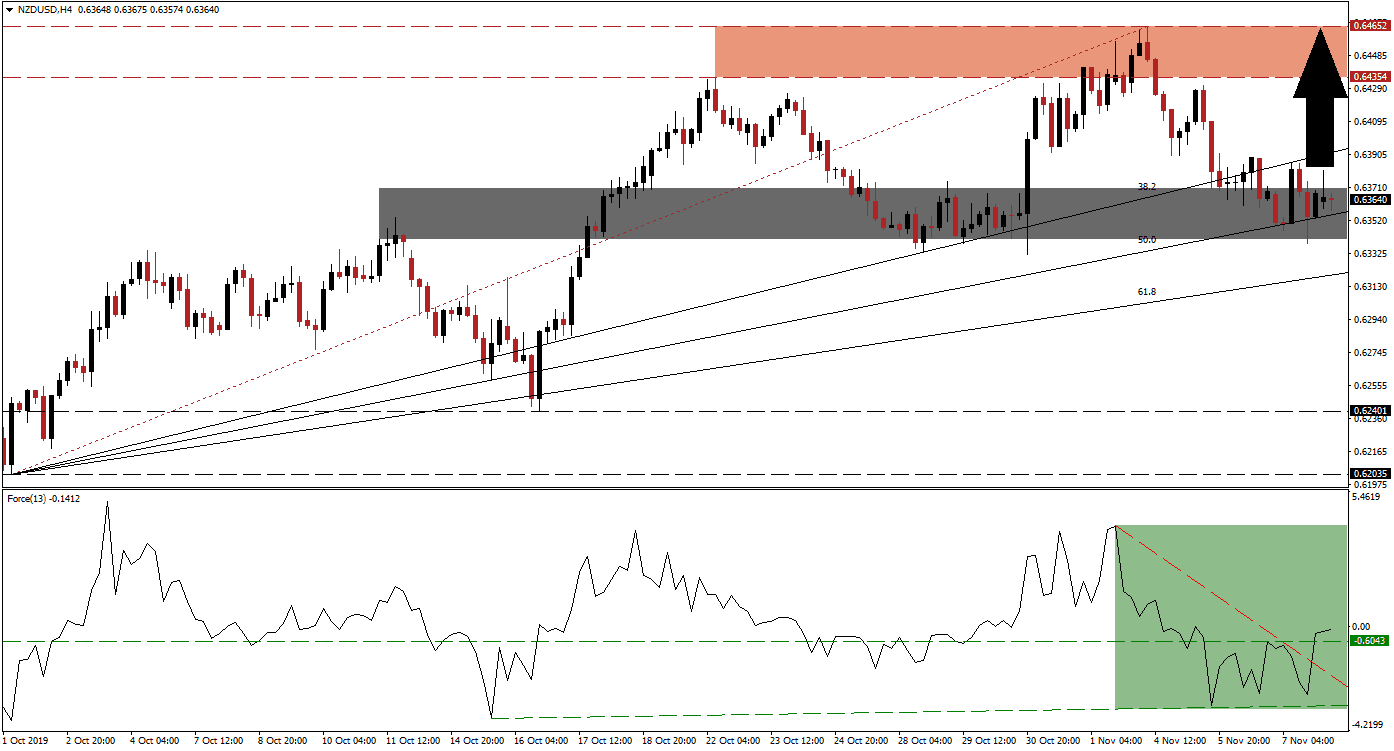
Consumer credit in the US came in well below expectations in September and dropped sharply as compared to August. The US consumer kept the US economy moving by borrowing and spending. While this represents only one month’s data, it should be paid close attention to. The US Dollar enjoyed a counter-trend move, but the NZD/USD is showing signs of a potential price action reversal as this currency pair reached its 50.0 Fibonacci Retracement Fan Support Level; bullish momentum started to increase and the ascending Fibonacci Retracement Fan may pressure price action to the upside. You can learn more about the Fibonacci Retracement Fan here.
The Force Index, a next-generation technical indicator, descended with the NZD/USD as price action broke down below its resistance zone; after this currency pair reached its 50.0 Fibonacci Retracement Fan Support Level, the Force Index quickly advanced which indicates that bullish momentum is expanding. Another bullish development materialized as this technical indicator created a higher low while price action completed a breakdown below its 38.2 Fibonacci Retracement Fan Support Level; this created a minor positive divergence. The Force Index has now moved above its descending resistance level and broke out above its horizontal resistance level, turning it into support as marked by the green rectangle.
As the 50.0 Fibonacci Retracement Fan Support Level is crossing through a short-term support zone, located between 0.63407 and 0.63706 as marked by the grey rectangle, upside pressure is increasing. This short-term support zone has previously reversed a breakdown in the NZD/USD below its resistance zone while also reversing an advance when it acted as a short-term resistance zone. Forex traders should monitor the intra-day high of 0.63856 which represents the peak from an advance which started from the 50.0 Fibonacci Retracement Fan Support Level and was reversed by the 38.2 Fibonacci Retracement Fan Resistance Level; a move above it is expected to lead price action into a breakout.
This currency pair is likely to retrace its short-term corrective phase back into its resistance zone which is located between 0.64354 and 0.64652 as marked by the red rectangle. The long-term fundamental picture favors a stronger NZD/USD as the New Zealand economy is set to benefit from next year’s RCEP trade pact while the US continues to battle global trade wars with China and the EU. Technical factors support a price action reversal and given the magnitude of the advance, a breakout above its resistance zone is possible. You can learn more about a resistance zone here.
NZD/USD Technical Trading Set-Up - Price Action Reversal Scenario
- Long Entry @ 0.63600
- Take Profit @ 0.64650
- Stop Loss @ 0.63300
- Upside Potential: 105 pips
- Downside Risk: 30 pips
- Risk/Reward Ratio: 3.50
A reversal in the Force Index, supported by a fresh bearish fundamental catalyst for the NZD/USD, could pressure price action into a breakdown and its descending resistance level may lead this currency pair into its next long-term support zone. This zone is located between 0.62035 and 0.62401 and should be viewed as an excellent long-term buying opportunity.
NZD/USD Technical Trading Set-Up - Limited Breakdown Scenario
- Short Entry @ 0.63150
- Take Profit @ 0.62400
- Stop Loss @ 0.63450
- Downside Potential: 75 pips
- Upside Risk: 30 pips
- Risk/Reward Ratio: 2.50

