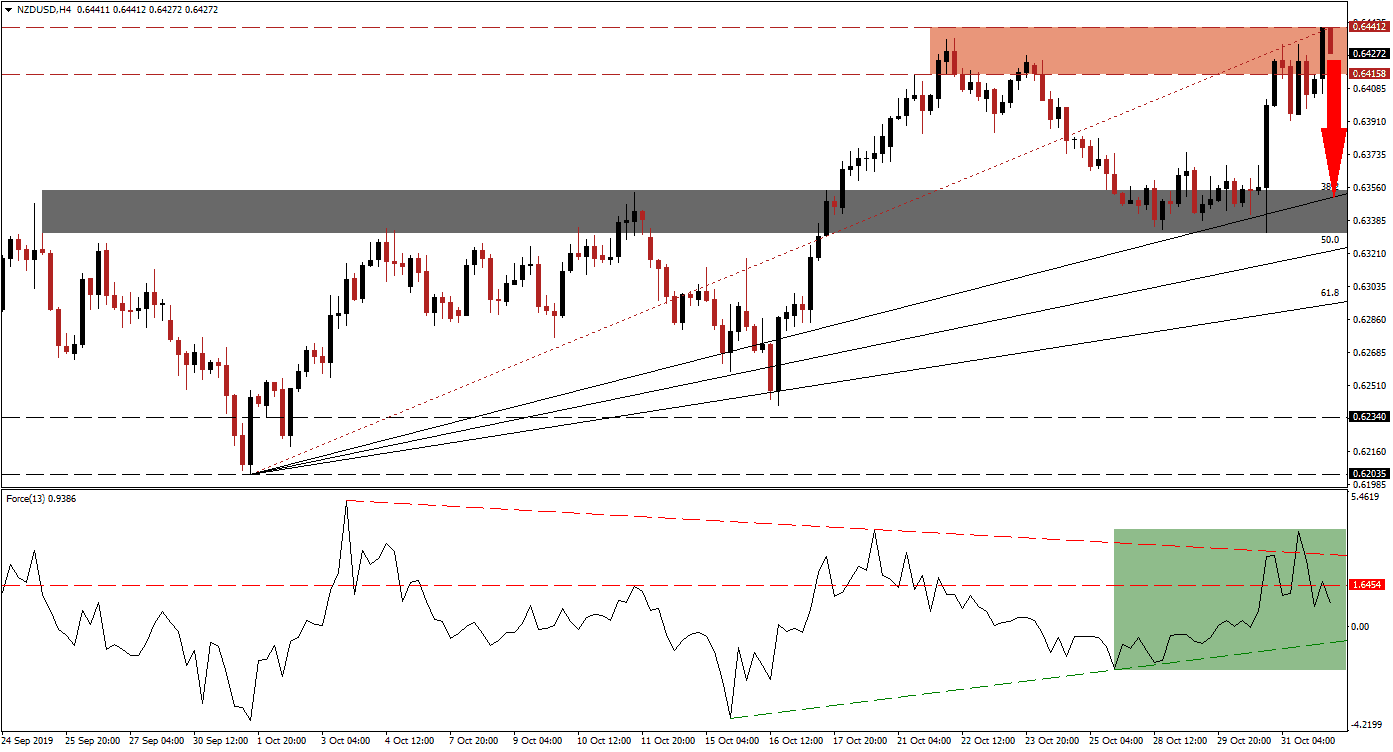
New Zealand economic data showed a recovery in consumer confidence for the month of October, and a China manufacturing PMI posted a surprise expansion against the backdrop of economists who called for a slowdown. This caused the NZD/USD to spike to a slightly higher high, before momentum retreated; markets await the US NFP report which will be released later in today’s session. The long-term uptrend in this currency remains intact, but a short-term pull-back is expected on the back of a profit-taking sell-off which should lead to a higher low before a bigger advance can materialize.
The Force Index, a next generation technical indicator, spiked higher together with price action and briefly pierced its descending resistance level before reversing direction; this resulted in a breakdown below its horizontal support level and turned it into resistance as marked by the green rectangle. Bullish momentum continues to fade inside the resistance zone, and the Force Index is expected to contract further until it can reach its ascending support level. This would also take it into negative territory, placing bears in charge of price action and leading the NZD/USD into a corrective phase. You can learn more about the Force Index here.
Bearish pressures are on the rise and this currency pair is likely to complete a breakdown below its resistance zone which is located between 0.64158 and 0.64412 as marked by the red rectangle. With the long-term bullish trend intact, a short-term reversal is expected to provide the necessary boost for the long-term advance to result in a higher high. Forex traders should monitor the intra-day low of 0.63915 which marks the low after the NZD/USD was rejected by its Fibonacci Retracement Fan trend line from where it advanced to a higher high; a breakdown below this level is likely to increase selling pressure on this currency pair.
Downside potential should be limited to its next short-term support zone which is located between 0.63322 and 0.63544 as marked by the grey rectangle; the 38.2 Fibonacci Retracement Fan Support Level is currently located inside this zone near the top range, and the 50.0 Fibonacci Retracement Fan Support Level is closing in on the bottom range. A corrective phase into the top range of this zone will result in a higher low, keep the long-term uptrend alive and is expected to result in the next phase of the advance in the NZD/USD. You can read more about the Fibonacci Retracement Fan here.
NZD/USD Technical Trading Set-Up - Breakdown Scenario
- Short Entry @ 0.64300
- Take Profit @ 0.63500
- Stop Loss @ 0.64550
- Downside Potential: 80 pips
- Upside Risk: 25 pips
- Risk/Reward Ratio: 3.20
In the event of a reversal in the Force Index which will lead to a breakout above its horizontal resistance level, followed by a push above its descending resistance level, the NZDUSD could attempt a breakout above its resistance zone. The fundamental picture favors more long-term upside, but the technical scenario suggests a short-term reversal. The next resistance zone is located between 0.65558 and 0.65874.
NZD/USD Technical Trading Set-Up - Breakout Scenario
- Long Entry @ 0.64750
- Take Profit @ 0.65555
- Stop Loss @ 0.64450
- Upside Potential: 80 pips
- Downside Risk: 30 pips
- Risk/Reward Ratio: 2.67

