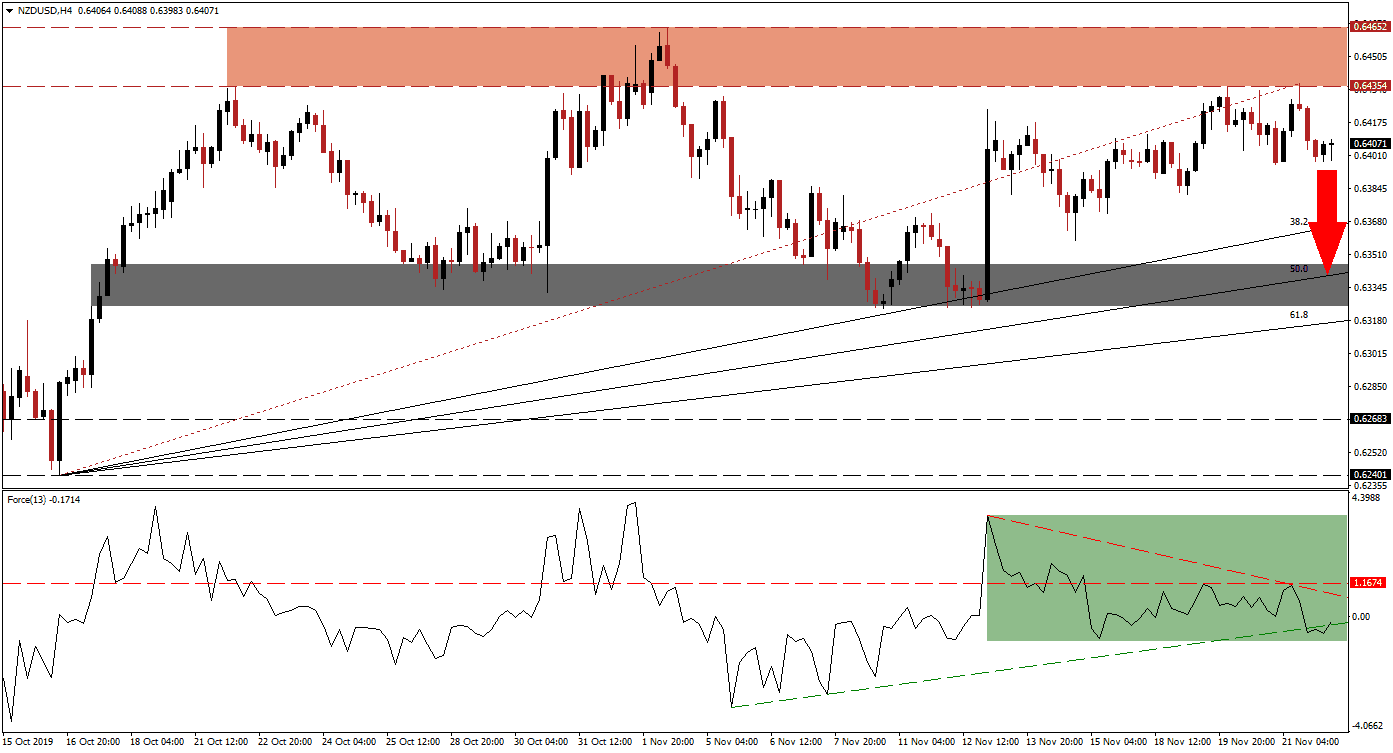
While the long-term outlook for the NZD/USD remains bullish, a short-term corrective phase is expected to follow the breakdown in this currency pair below its resistance zone. Despite the continued delay in the phase one trade truce between the US and China, the US Dollar has not adjusted to fundamental developments. Following the breakdown, the Fibonacci Retracement Fan sequence has been re-drawn to assess future price action moves more accurately. A corrective phase into the 50.0 Fibonacci Retracement Fan Support Level is currently expected; this will keep the long-term uptrend intact. You can learn more about the Fibonacci Retracement Fan here.
The Force Index, a next-generation technical indicator, confirmed the breakdown in the NZD/USD with a breakdown below its horizontal support level. Adding to the short-term bearish outlook from a technical perspective is the formation of a negative divergence which suggests a price action reversal. The Force Index has paused at its ascending support level as marked by the green rectangle, but this technical indicator has moved into negative territory which placed bears in charge of price action. As long as the Force Index remains below its descending resistance level, more downside in this currency pair should follow.
After price action was rejected by its resistance zone for the fourth time, the NZD/USD moved below its Fibonacci Retracement Fan trendline which added to bearish pressures. A corrective phase is now necessary in order to allow a renewed build-up in bullish momentum before this currency pair can attempt another breakout attempt above its resistance; this zone is located between 0.64354 and 0.64652 as marked by the red rectangle. You can learn more about a resistance zone here.
Forex traders are now advised to monitor the intra-day low of 0.63963 which marks the low of the previous rejection of the currency pair by its resistance zone. This was reversed and led to an insignificant higher high, but a move below this level may inspire a profit-taking sell-off. The injection of selling pressure should provide the catalyst for the NZD/USD to correct into its next short-term support zone which awaits price action between 0.63251 and 0.6346 as marked by the grey rectangle. A breakdown below this level would require a fresh fundamental catalyst which is currently not expected.
NZD/USD Technical Trading Set-Up - Breakdown Extension Scenario
⦁ Short Entry @ 0.64050
⦁ Take Profit @ 0.63400
⦁ Stop Loss @ 0.64250
⦁ Downside Potential: 65 pips
⦁ Upside Risk: 20 pips
⦁ Risk/Reward Ratio: 3.25
In the event of a double breakout in the Force Index above its descending resistance level and its horizontal resistance level, the NZD/USD may attempt a fifth breakout attempt above its resistance zone. The current technical picture points towards a corrective phase and a new fundamental catalyst would be required in order to counter short-term bearish pressures. The next resistance zone is located between 0.65149 and 0.65558.
NZD/USD Technical Trading Set-Up - Breakout Scenario
⦁ Long Entry @ 0.64750
⦁ Take Profit @ 0.65250
⦁ Stop Loss @ 0.64500
⦁ Upside Potential: 50 pips
⦁ Downside Risk: 25 pips
⦁ Risk/Reward Ratio: 2.00

