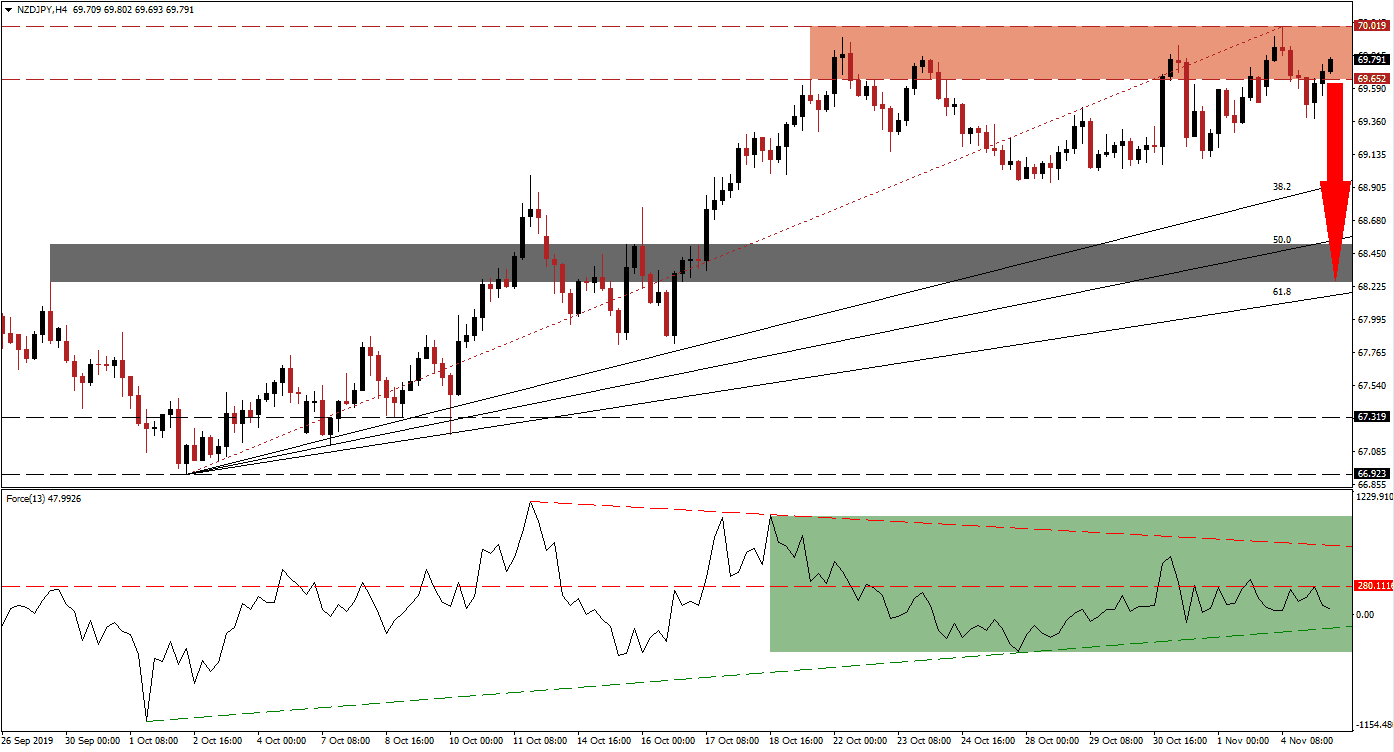
Risk-on mood has swept across global financial markets with US equity markets at all time highs despite a continuing string of economic disappointments and red flags which appear under the surface. The Japanese Yen, a safe haven currency, is therefore under selling pressure which push the NZD/JPY into its resistance zone. As more economic data was released yesterday out of the US and this morning across Asia, pointing to a much weaker than expected economy, bullish momentum is receding. Price action is now vulnerable to a breakdown sequence which should close the gape between this currency pair and its Fibonacci Retracement Fan sequence.
The Force Index, a next generation technical indicator, has gradually decreased after this currency pair first moved into its resistance zone; the emergence of a negative divergence during the advance pointed towards a pending breakdown in the uptrend. The Force Index started to contract from a lower high and descended to a lower low, this represented another bearish development. A breakdown below its horizontal support level turned it into resistance while another lower high was created; this technical indicator is now drifting lower, as marked by the green rectangle, and is expected to initiate a breakdown below its ascending support level. The NZD/JPY is likely to follow with a breakdown of its own. You can read more about the Force Index here.
Bullish momentum is being depressed inside the resistance zone, located between 69.652 and 70.019 as marked by the red rectangle; this zone has resulted in four breakdowns so far which were all reversed. Another breakdown is now the likely next move in the NZD/JPY, partially driven by fundamental data and partially by a profit-taking sell-off. While a breakdown in the Forced Index below its ascending support level may lead price action lower, forex traders should also monitor the intra-day low of 69.381; this marks the low of the previous breakdown and a move below it is expected to result in the addition of new net short positions.
After the advance in the NZD/JPY, price action became disconnected to its Fibonacci Retracement Fan sequence and a breakdown is set to close the gap to its ascending 38.2 Fibonacci Retracement Fan Support Level. A corrective phase in this currency pair is likely to extend into its next short-term support zone which is located between 68.249 and 68.510 as marked by the grey rectangle; the 50.0 Fibonacci Retracement Fan Support Level has eclipsed this zone. A further breakdown is possible, especially if more data will be released which points to a weaker than expected global economy. The next long-term support zone is located between 66.923 and 67.319. You can learn more about a support zone here.
NZD/JPY Technical Trading Set-Up - Breakdown Scenario
⦁ Short Entry @ 69.800
⦁ Take Profit @ 68.250
⦁ Stop Loss @ 70.050
⦁ Downside Potential: 155 pips
⦁ Upside Risk: 25 pips
⦁ Risk/Reward Ratio: 6.20
Should the Force Index remain above its ascending support level and reverse into a double breakout, above its horizontal resistance level and the above its descending resistance level, the NZD/JPY could push for a breakout and extend its advance. The next resistance zone is located between 71.102 and 71.500 and a move into this zone should be viewed as an excellent short-selling opportunity as the fundamental scenario favors more downside in this currency pair, supported by technical factors.
NZD/JPY Technical Trading Set-Up - Limited Breakout Scenario
⦁ Long Entry @ 70.250
⦁ Take Profit @ 71.250
⦁ Stop Loss @ 69.900
⦁ Upside Potential: 100 pips
⦁ Downside Risk: 35 pips
⦁ Risk/Reward Ratio: 2.86

