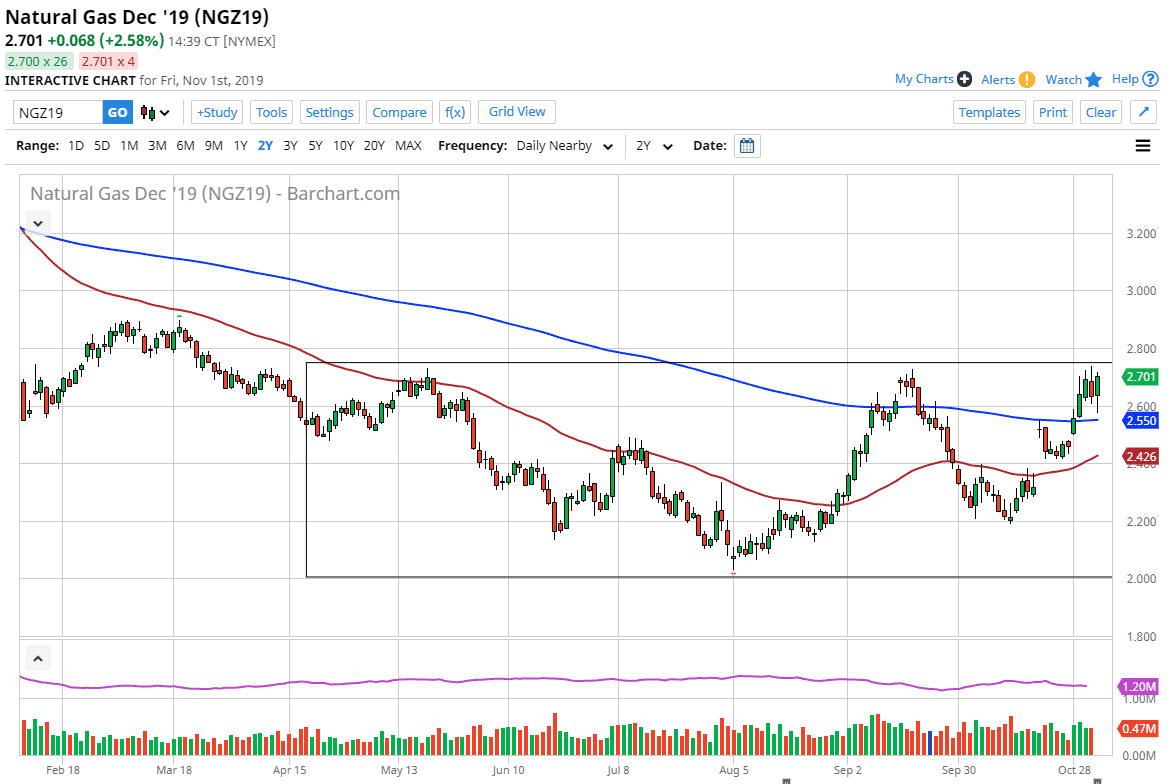
Natural gas markets have initially fallen during the trading session on Friday but found enough support underneath the turn things around a start to break to the upside. As they did, it suggests that we are going to break out and continue to go much higher. The $2.75 level will be massive resistance, and if we can break above there is very likely that we continue to go much higher as we are in that time of year. After all, the United States is getting colder and that means that a lot more demand for natural gas will be out there. Beyond that, the European Union is also going to be demanding more natural gas and that makes sense that the price will continue to go higher.
This is one of my favorite cyclical trades, as every year this market breaks to the upside and goes higher. The question isn’t so much as to whether or not it happens, but how far will it go? That isn’t easily foreseen, but I do think that the most logical place for an initial target for longer-term trading will probably be the $3.00 level. Beyond that, I would look for moves every $0.20 or so to face serious resistance. That doesn’t mean we go straight up in the air without trouble, and obviously there will be occasional pullbacks that you can take advantage of.
To the downside I see the 200 day EMA offering support, as it looks like the market is starting to recognize the 200 day EMA as the “floor” instead of the ceiling. Ultimately, we are trading between that and the structurally important $2.75 level, so I feel that the market is starting to build up enough inertia to finally make that move to the upside. The move, which happens this time every year, can quite often run until the middle of January meaning that this could become more of a “buy-and-hold” scenario than anything else. For the shorter-term trader, it means that you will be looking for short-term pullbacks to take advantage of as they should offer “value” in a market that is going to have a lot of demand placed upon it over the next couple of months. Looking at this chart, we could have quite a bit of distance to cover as the market had been beaten down so significantly. Sometime in the middle of January, I will become massively bearish.

