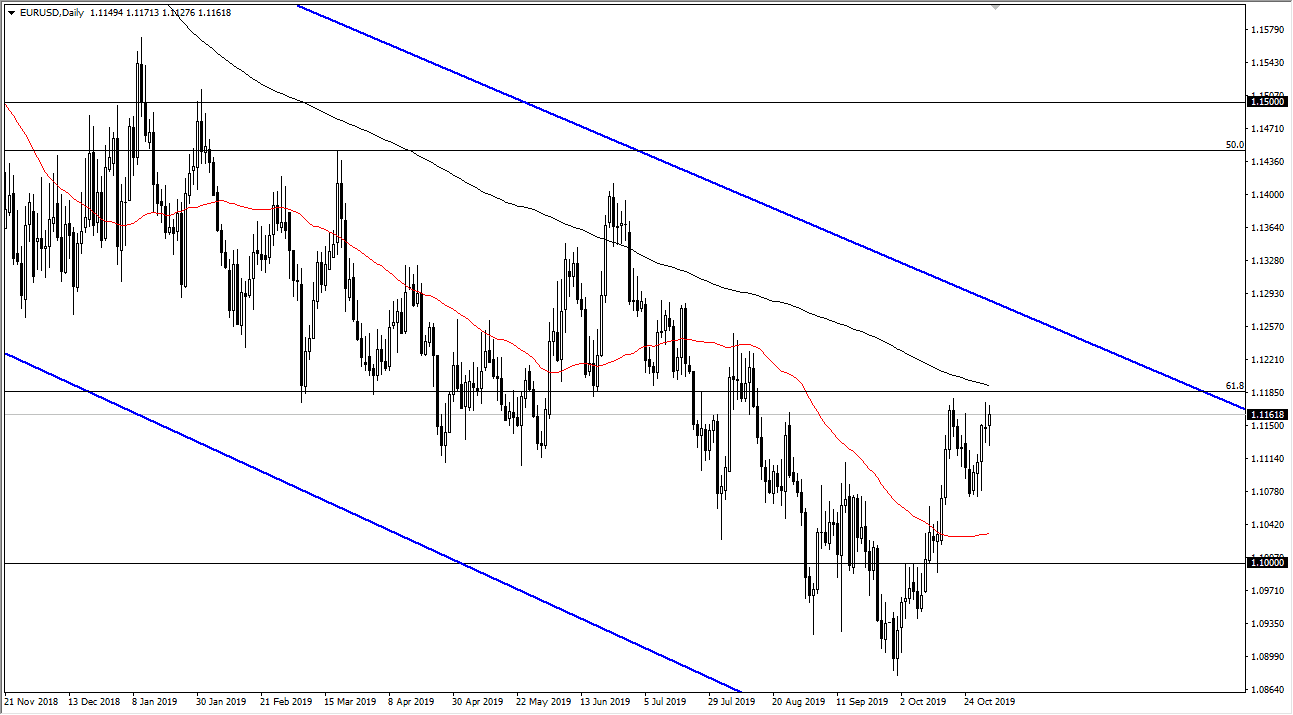
The Euro has initially fallen during the trading session on Friday as the jobs number came out better than anticipated. However, the market turned around to show signs of life again. That is good sign, and it looks as if the 1.12 level is going to be a major resistance level. At this point, the market is very likely to continue to look at the 1.12 level as not only a target but also a barrier. The 200 day EMA above the 1.12 level is starting to get close and is sloping lower. Beyond that, the European Central Bank has started another phase of quantitative easing, so I think that it’s probably only a matter of time before the Euro pulls back due to the interest rate differential or perhaps just the liquidity measures being taken.
Looking at the chart, it’s likely that there is still significant support at the 1.1075 level underneath, and at this point it’s very likely that the market is going to continue to look at that as an area that it will target. Beyond that, there is a lot of resistance above so even though the candlestick on Friday was somewhat bullish. The 200 day EMA, the 1.12 level, and the 61.8% Fibonacci retracement level from the bigger move higher is sitting just above and should offer resistance. At the first signs of exhaustion, I am more than willing to sell this pair.
We look to the left, right around the end of July, there are several long wicks just above the 1.12 level where we fell from. These wicks represent a lot of selling pressure and exhaustion on those days and I think that will continue to keep the market somewhat negative in general. Ultimately, the market is looking very likely to continue to go lower given enough time, based upon not only fundamental reasoning, but the fact that while the European Central Bank is liquefying the markets it appears that the Federal Reserve is standing on the sidelines at this point, pausing monetary policy. While it isn’t necessarily strong, it isn’t weakening either, so it makes sense that this market drifts a bit lower. All of that being said, if the market breaks above the 1.1250 level, then I start to look for buying opportunities in a market that could be changing quite drastically and could be a new story to start paying attention to.

