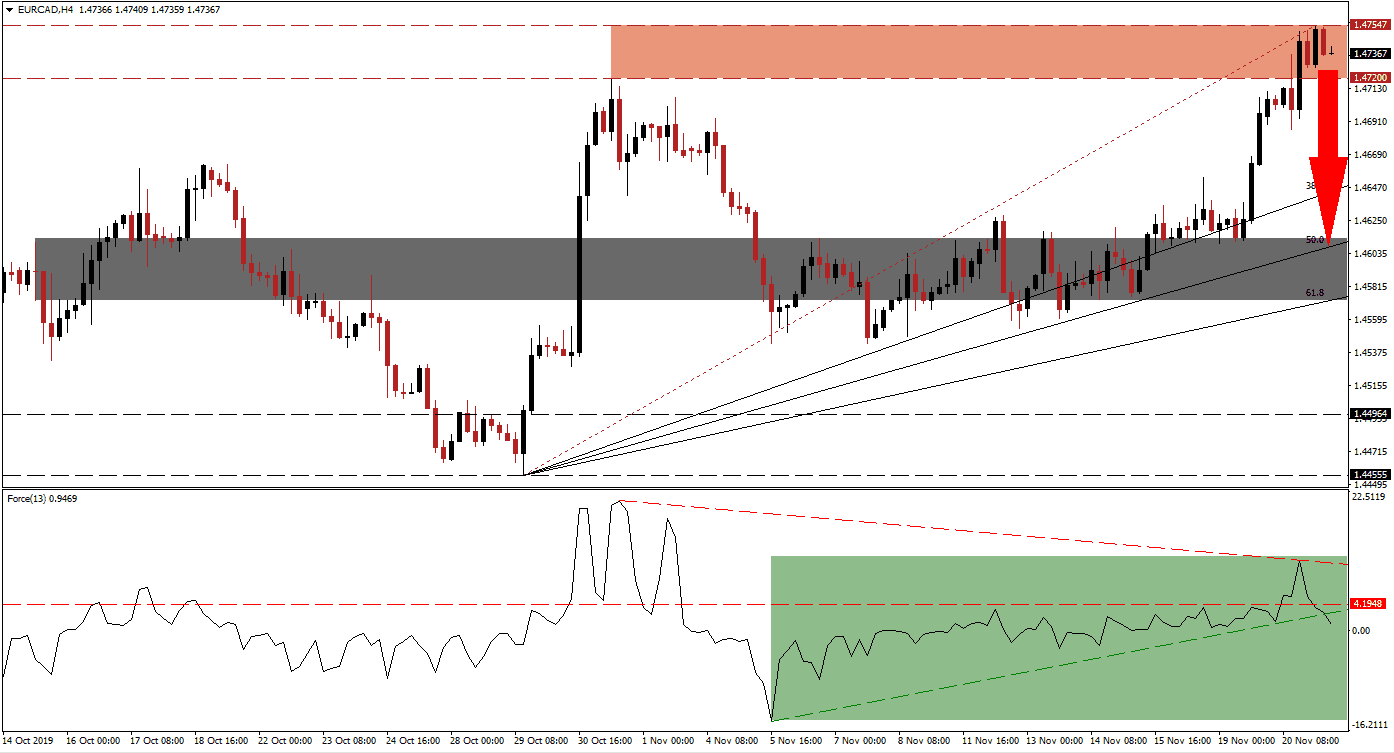
Further upside potential in the EUR/CAD remains exhausted as this currency pair advanced into its resistance zone. The general weakness in oil prices has added downside pressure on the Canadian Dollar, a commodity currency that is also under threat by the Bank of Canada which is considering an interest rate cut, but the Euro has a list of issues to master. Today’s German Bundesbank Financial Stability Review will be in focus. Price action is currently in the process of ending its advance inside its resistance zone from where a breakdown is expected to materialize.
The Force Index, a next-generation technical indicator, is flashing three warning signals which confirm that a price action reversal is imminent. A negative divergence formed as the EUR/CAD moved into its resistance zone with a higher high; this bearish development resulted in a momentum loss and the Force Index completed a breakdown below its horizontal support level, turning it into resistance. This technical indicator has now additionally moved below its ascending support level and turned it into temporary resistance as marked by the green rectangle. A breakdown in the Force Index into negative territory is expected to lead this currency pair into a corrective phase. You can learn more about the Force Index here.
A breakdown in the EUR/CAD below its resistance zone, located between 1.47200 and 1.47547 as marked by the red rectangle, is likely to initiate a profit-taking sell-off. This is expected to close the gap between price action and its Fibonacci Retracement Fan. The most recent intra-day high of 1.47547 represents a higher high and if the anticipated correction will run out of steam at its ascending 50.0 Fibonacci Retracement Fan Support Level, the long-term uptrend will remain intact. The Euro, despite its fundamental concerns, is receiving an unlikely boost from the US Federal Reserve and its balance sheet expansion; this is countering negative developments out of the ECB.
An improvement in Eurozone economic data started to simmer through, but it remains premature to identify a trend. Given the rise in bearish pressures, the EUR/CAD is expected to enter a corrective phase that should take it into its next short-term support zone, located between 1.45723 and 1.46132 as marked by the grey rectangle. The 50.0 Fibonacci Retracement Fan Support Level is nearing the top range of this zone and forex traders are recommended to monitor price action near this level; the 61.8 Fibonacci Retracement Fan Support Level entered the bottom range of the short-term support zone. You can learn more about the Fibonacci Retracement Fan here.
EUR/CAD Technical Trading Set-Up - Breakdown Scenario
⦁ Short Entry @ 1.47350
⦁ Take Profit @ 1.46100
⦁ Stop Loss @ 1.47700
⦁ Downside Potential: 125 pips
⦁ Upside Risk: 35 pips
⦁ Risk/Reward Ratio: 3.57
Should the Force Index reverse, a triple breakout would be required to elevate the EUR/CAD to the upside. Besides moving above its ascending support level which acts as temporary resistance, a breakout above its horizontal resistance level is required, followed by a move above its descending resistance level. While a potential long-term extension of the uptrend remains a possibility, the short-term conditions point towards a corrective phase in this currency pair. The next resistance zone awaits price action between 1.48582 and 1.49138.
EUR/CAD Technical Trading Set-Up - Limited Breakout Scenario
⦁ Long Entry @ 1.48100
⦁ Take Profit @ 1.49000
⦁ Stop Loss @ 1.47650
⦁ Upside Potential: 90 pips
⦁ Downside Risk: 45 pips
⦁ Risk/Reward Ratio: 2.00

