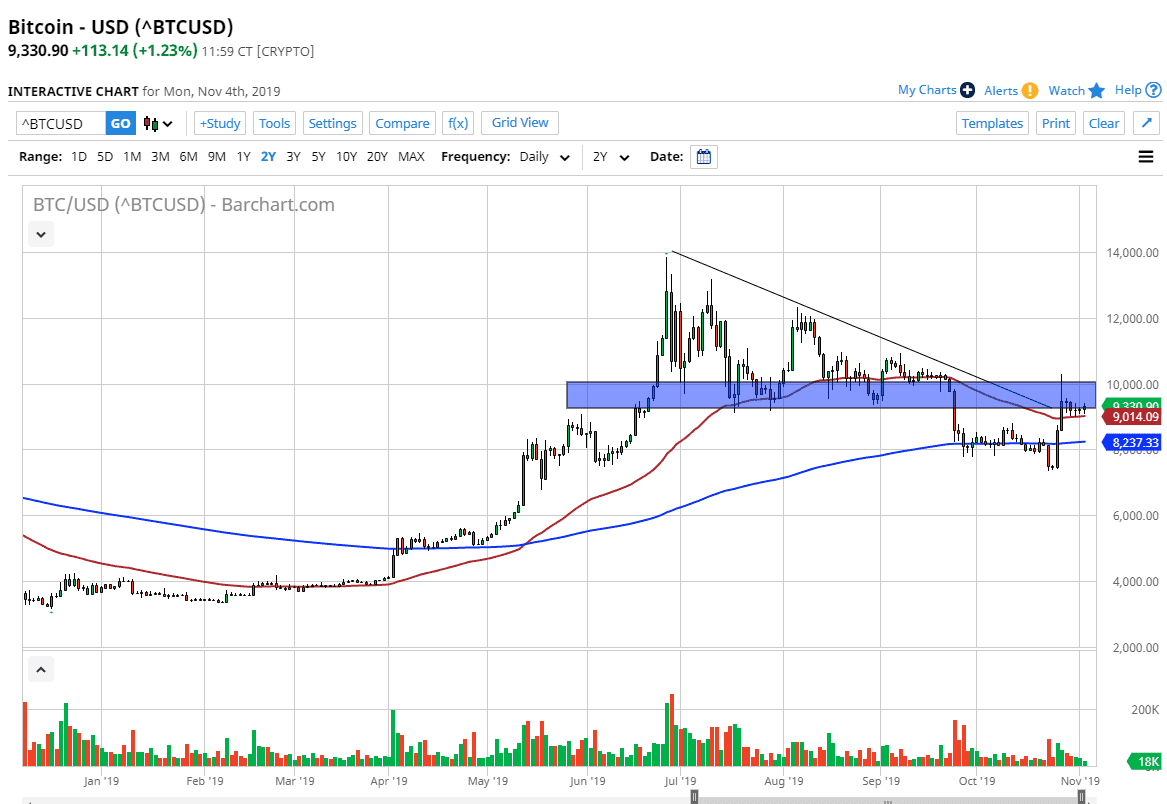
The Bitcoin markets have rallied about 1% during the trading session on Monday, as the market continues to go back and forth overall. Keep in mind that the market participants will continue to look at the Bitcoin market through the lens of central bank easing, which is a bit surprising considering that it hasn’t picked up the market like it used to. Ultimately, I have been talking about the $10,000 level been crucial, and perhaps an area that if we could close above on a daily chart then we can reestablish long positions.
However, after we got that boost due to the Chinese suggesting they were going to invest heavily in block chain, Bitcoin has done almost nothing. The fact that we could not continue that upward momentum tells me that the market is going to be very unlikely to continue going higher. However, I am more than willing to change my opinion as soon as we get a daily close above the $10,000 level. Until then, I am a bit suspicious of these rallies, mainly because there was the massive descending triangle above that kicked off the selling pressure.
The 50 day EMA underneath is support, but if we break down below there more than likely opens up the market to reach down towards the 200 day EMA which is currently trading near the $8250 level. If we were to break down below the $8000 level, then the market could continue the overall negativity that we have seen from a breakdown of that descending triangle, which measures for an attempt to reach down towards the $4800 level. Granted, it’s going to take quite a bit of negativity get there, and let’s be honest here, Bitcoin can sit still forever. That being said, I’m simply looking for some type of impulsive candlestick to tell me which direction to trade next. Right now, it still looks negative, simply because there’s been no follow-through on the bullish move more than anything else. It isn’t going to be easy, but eventually we should see some type of impulsive candle that we can follow. Until then it’s probably best to simply observe Bitcoin, as it will eventually have to make some type of decision. Once it does, following is the best thing that we can do as the market should continue to go higher. All things being equal, the market is likely to make a move, and when it does you simply follow.

