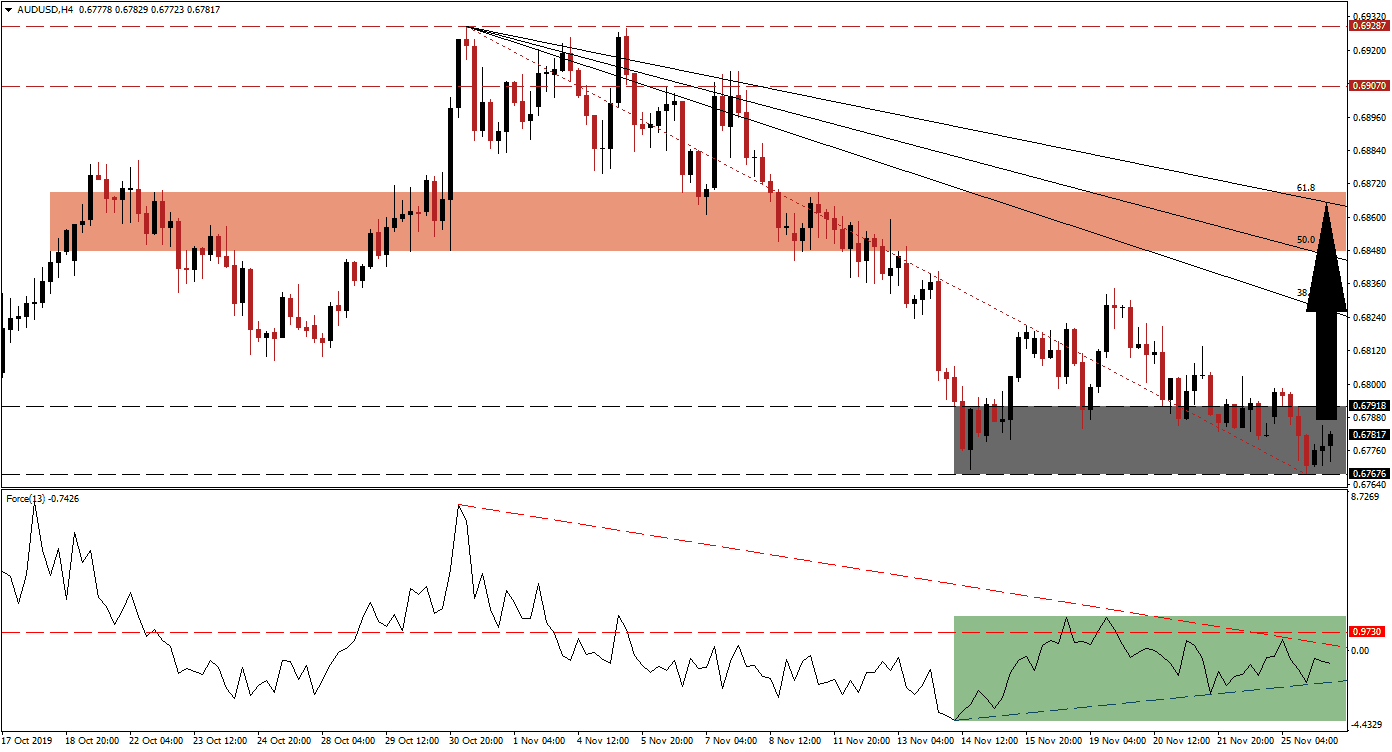
Australian consumer confidence decreased ahead of the key holiday shopping season, but a phone call between officials from the US and China has once again grabbed the headlines. According to the Chinese Ministry of Commerce, progress has been made to sign a phase one trade truce, which a growing minority of market participants branded hollow and meaningless. The AUD/USD stabilized inside its support zone and bullish momentum started to increase. This currency pair is now ripe for a short-covering rally that should take price action back into its next short-term resistance zone.
The Force Index, a next-generation technical indicator, started to ascend after this currency pair reached its support zone and shows the build-up in bullish momentum as marked by the green rectangle. The steady increase in the Force Index is now expected to lead to a breakout above its descending resistance level and lead the AUD/USD into a breakout of its own. A breakout would move this technical indicator into positive conditions and place bulls in charge of price action. Momentum is likely to elevate the Force Index above its horizontal resistance level and convert it into support which will ignite the anticipated short-covering rally. You can learn more about the Force Index here.
Another bullish development materialized after price action moved above its Fibonacci Retracement Fan trendline following a failed breakout attempt above its support zone; this zone is located between 0.67676 and 0.67918 as marked by the grey rectangle. Forex traders are advised to monitor the intra-day high of 0.67985 which represents the peak of the last time this currency pair attempted to advance out of its support zone. A move higher should clear the path for the AUD/USD to close the gap to its descending 38.2 Fibonacci Retracement Fan Resistance Level.
A short-covering rally may run out of steam as price action will reach its next short-term resistance zone, located between 0.68477 and 0.68689 as marked by the red rectangle. The 50.0 Fibonacci Retracement Fan Resistance Level just moved below this zone with the 61.8 Fibonacci Retracement Fan Resistance Level passing through it. A fundamental catalyst would be required to turn the short-covering rally in the AUD/USD into a bigger advance. A move into the short-term resistance zone will keep the established downtrend intact. The next long-term resistance zone awaits this currency pair between 0.69070 and 0.69287. You can learn more about a resistance zone here.
AUD/USD Technical Trading Set-Up - Breakout Scenario
⦁ Long Entry @ 0.67800
⦁ Take Profit @ 0.68600
⦁ Stop Loss @ 0.67600
⦁ Upside Potential: 80 pips
⦁ Downside Risk: 20 pips
⦁ Risk/Reward Ratio: 4.00
In the event of a breakdown in the Force Index below its ascending support level, the AUD/USD may attempt a breakdown below its support zone. The technical picture points towards a short-term reversal, but volatility is expected to remain elevated and a breakdown may take this currency pair into its next support zone located between 0.66701 and 0.67019. This should be considered an excellent long-term buying opportunity.
AUD/USD Technical Trading Set-Up - Breakdown Scenario
⦁ Short Entry @ 0.67400
⦁ Take Profit @ 0.66850
⦁ Stop Loss @ 0.67700
⦁ Downside Potential: 65 pips
⦁ Upside Risk: 30 pips
⦁ Risk/Reward Ratio: 2.17

