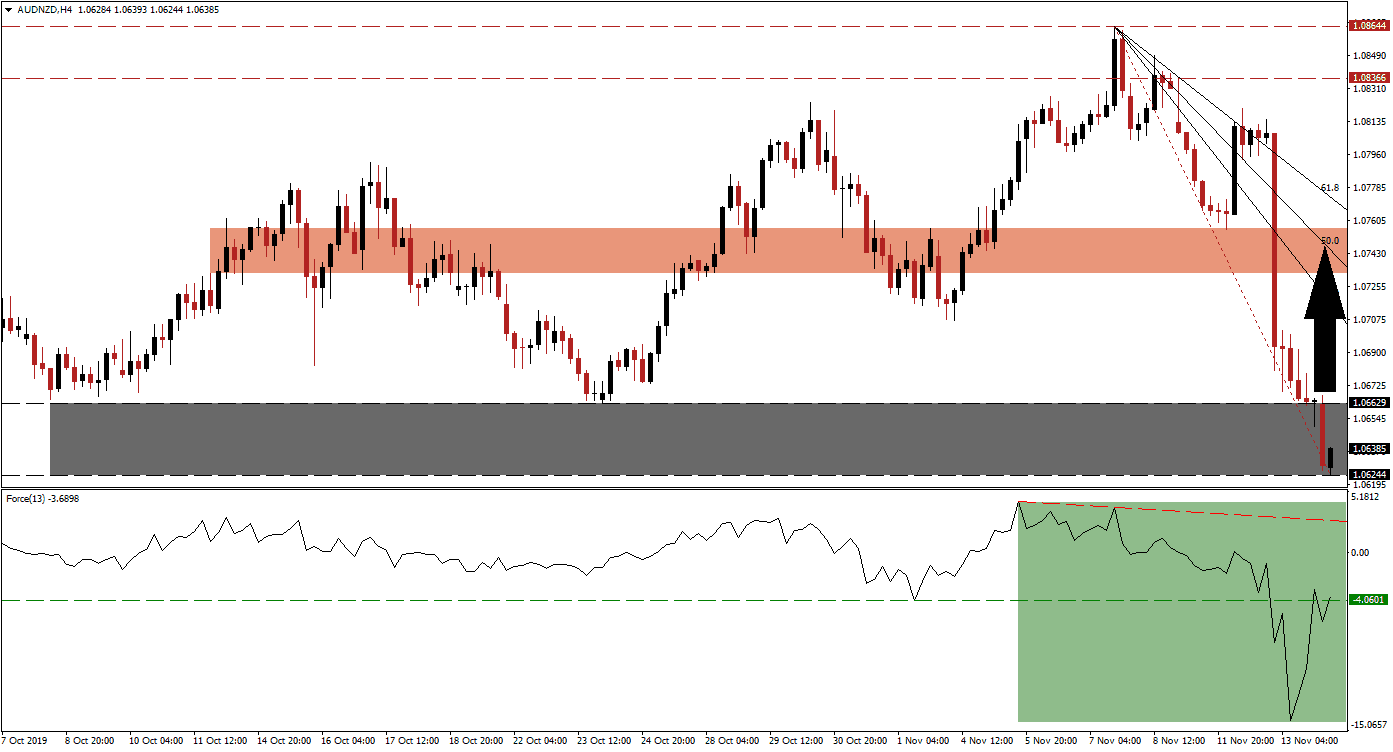
A combination of fundamental developments has caused a violent sell-off in the AUD/NZD. The Reserve Bank of New Zealand surprised markets by keeping interest rates unchanged as economists expected a 25 basis point interest rate cute; this was followed by an unexpected job loss in Australia for the month of October. This created a steep Fibonacci Retracement Fan, but the support zone has halted contraction in this currency pair which was partially fueled by a profit-taking sell-off. Bullish momentum started to recover after price action reached the top range of its support zone.
The Force Index, a next-generation technical indicator, confirmed the sell-off in the AUD/NZD and dropped to a fresh low. As price action approached the support-zone, selling pressure eased and the Force Index made a string recovery which has now pushed it above its horizontal resistance level and turned it into support; this is marked by the green rectangle. The Force Index remains in negative conditions and bears are still in charge, but losing strength fast as the magnitude of the directional change is now expected to push this technical indicator into positive territory which is likely to lead price action into a reversal. You can learn more about the Force Index here.
This currency started to stabilize inside its support zone, located between 1.06244 and 1.06629 as marked by the grey rectangle. Adding to the downside pressures which led to the sell-off was Chinese data which showed weaker than expected industrial production as well as retail sales and forex traders should now monitor the Force Index for a push above the 0 centerline which is expected to lead the AUD/NZD to the upside and close the gap to the Fibonacci Retracement Fan which developed due to the fast descend in price action.
Prior to the sell-off, a bullish chart pattern drove this currency to the upside; a series of higher highs and higher lows was formed after price action accelerated from the top range of the support zone. This pattern has now been broker, but the AUD/NZD should be able to recover out of extreme oversold conditions and advance into its short-term resistance zone which is located between 1.07323 and 1.07563 as marked by the red rectangle. The 50.0 Fibonacci Retracement Fan Resistance level is passing through this zone. You can learn more about a resistance zone here.
AUD/NZD Technical Trading Set-Up - Breakout Scenario
⦁ Long Entry @ 1.06350
⦁ Take Profit @ 1.07400
⦁ Stop Loss @ 1.06100
⦁ Upside Potential: 105 pips
⦁ Downside Risk: 25 pips
⦁ Risk/Reward Ratio: 4.20
While the Force Index has more room to expand to the upside, until it will reach its descending resistance level, a reversal cannot be ruled out due to the elevated volatility level. After the surprise RBNZ monetary decision, the long-term outlook for the AUD/NZD is clouded with a bullish bias while the short-term technical picture favors a reversal. Should this currency pair be pressured into a breakdown, the next support zone awaits price action between 1.04809 and 1.05306 which should be considered a solid long-term buying opportunity.
AUD/NZD Technical Trading Set-Up - Breakdown Scenario
⦁ Short Entry @ 1.05800
⦁ Take Profit @ 1.05000
⦁ Stop Loss @ 1.06100
⦁ Downside Potential: 80 pips
⦁ Upside Risk: 30 pips
⦁ Risk/Reward Ratio: 2.67

