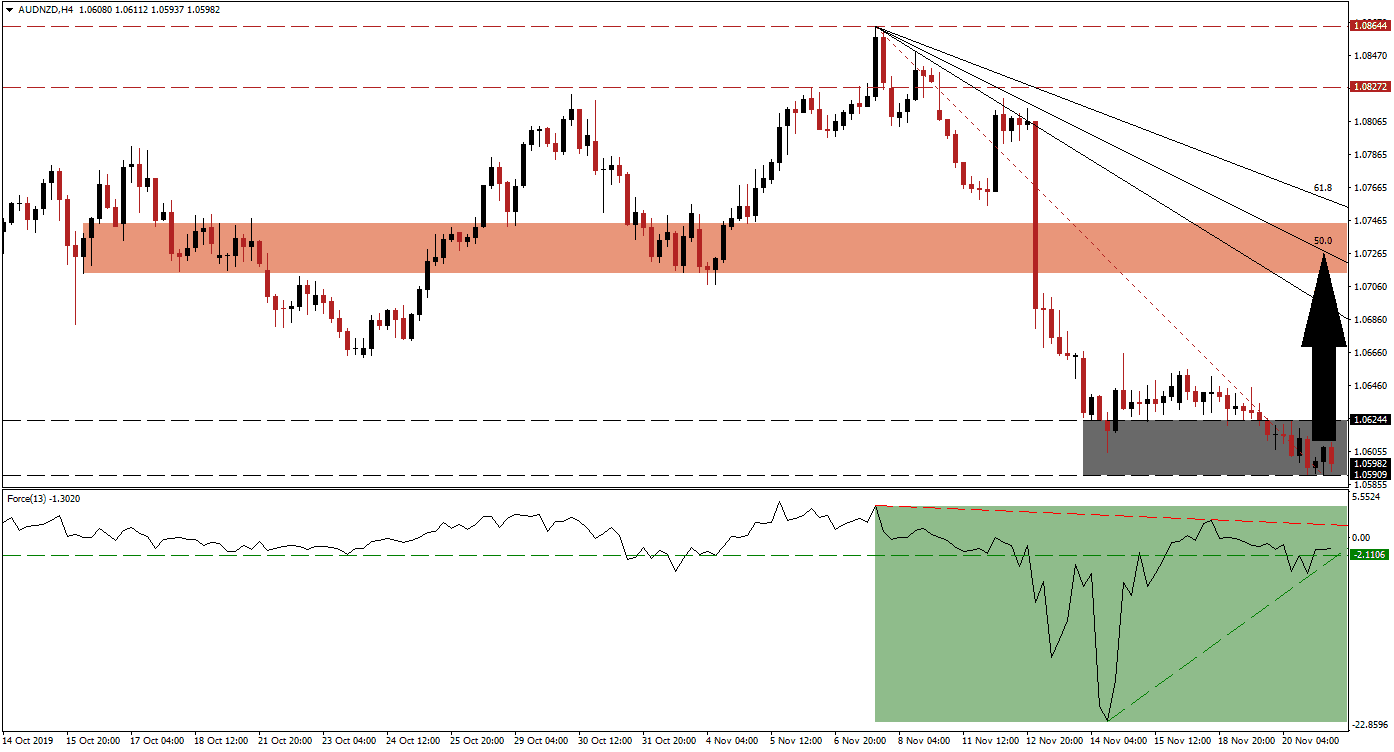
Bullish momentum started to accelerate after this currency pair reached its support zone which halted the corrective phase in the AUD/NZD. Concerns about the phase one trade truce between the US and China have resurfaced; US President Trump has threatened more tariffs and if he signs a controversial bill into law which supports protesters in Hong Kong, he may derail progress altogether. The strong sell-off has created a gap between price action and the Fibonacci Retracement Fan sequence, but the support zone is expected to spark a price action reversal. You can learn more about the Fibonacci Retracement Fan here.
The Force Index, a next-generation technical indicator, shows the sharp bullish recovery after the AUD/NZD reached its support zone; a positive divergence formed as a result which represents an early indicator that a price action reversal is in the process of materializing. As this currency pair inched out a lower low, the Force Index managed to eclipse its horizontal resistance level and turned it into support as marked by the green rectangle. Another bullish development emerged as the ascending support level crossed its converted horizontal support level, and a push by the Force Index into positive conditions is likely to lead an advance in this currency pair.
Economic data out of New Zealand showed a decrease in credit card spending while the Reserve Bank of Australia was less active in the forex market last month. The AUD/NZD is now expected to enter a price action reversal that will elevate it out of its support zone, located between 1.05909 and 1.06244 as marked by the grey rectangle. Forex traders should monitor the Force Index together with the intra-day high of 1.06448 which marks the peak before this currency pair descended to a lower low; a breakout above this level is expected to initiate a short-covering rally.
Closure of the gap between this currency pair and its Fibonacci Retracement Fan is anticipated to take price action into its next short-term resistance zone; this zone is located between 1.07140 and 1.07447 as marked by the red rectangle. The descending 50.0 Fibonacci Retracement Fan Resistance Level is currently passing through this zone and a breakout would require a fresh catalyst. The next long-term resistance zone awaits the AUD/NZD between 1.08272 and 1.08644 from where the corrective phase emerged. You can learn more about a resistance zone here.
AUD/NZD Technical Trading Set-Up - Breakout Scenario
⦁ Long Entry @ 1.06000
⦁ Take Profit @ 1.07200
⦁ Stop Loss @ 1.05650
⦁ Upside Potential: 120 pips
⦁ Downside Risk: 35 pips
⦁ Risk/Reward Ratio: 3.43
In case of a double breakdown in the Force Index, below its ascending and horizontal support levels, the AUD/NZD could attempt a breakdown below its support zone; this could be aided by its descending resistance level. The long-term fundamental picture suggests a move to the upside, and an advance is additionally supported by short-term technical developments. The next support zone is located between 1.04464 and 1.04956, a move into this zone should be considered a solid buying opportunity.
AUD/NZD Technical Trading Set-Up - Limited Breakdown Scenario
⦁ Short Entry @ 1.05450
⦁ Take Profit @ 1.04700
⦁ Stop Loss @ 1.05750
⦁ Downside Potential: 75 pips
⦁ Upside Risk: 30 pips
⦁ Risk/Reward Ratio: 2.50

