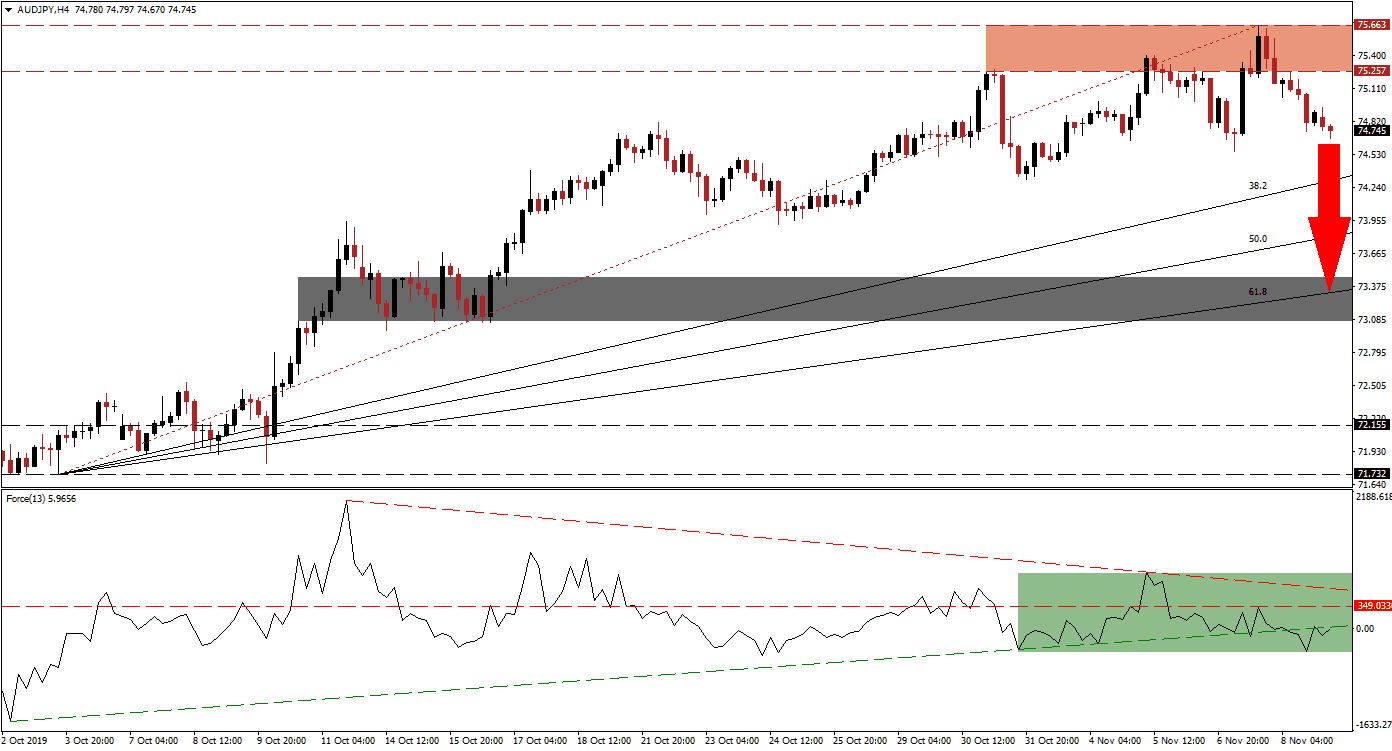
Economic data out of Japan came in weaker than expected as machine orders posted an unexpected monthly contraction, but the Japanese Yen extended its advance as it attracted capital inflows from risk-averse investors. Comments by US President Donald Trump in regards to tariffs further soured the economic optimism which pushed markets higher in November. The AUD/JPY completed a breakdown below its resistance zone as bearish momentum expanded, and is now expected to follow through with a breakdown sequence below its Fibonacci Retracement Fan.
The Force Index, a next-generation technical indicator, flashed a warning signal after this currency pair initially reached its resistance zone which was reversed before a second attempt led to a higher high; the Force Index contracted and a negative divergence formed. This led to a breakdown below its horizontal support level and turned it into resistance which also took this technical indicator into negative territory and placed bears in charge of the AUD/JPY. Another bearish development occurred when the Force Index pushed below its ascending support level and created a lower low as marked by the green rectangle.
After price action advanced from a small reversal into its short-term support zone, this currency pair created a series of higher highs and higher lows which established an uptrend supported by its ascending Fibonacci Retracement Fan. The breakdown below its resistance zone, located between 75.257 and 75.663 as marked by the red rectangle, is now threatening to violate this bullish chart formation. Forex traders should monitor the intra-day low of 74.556 which marks the low of the previous reversal, a breakdown below this level is expected to lead to more net sell positions and end the long-term advance of the AUD/JPY. You can learn more about a breakdown here.
With the slow return of risk-off mood, this currency pair is likely to initiate a breakdown sequence below its Fibonacci Retracement Fan sequence and take price action back into its short-term support zone. This zone is located between 73.070 and 73.453 as marked by the grey rectangle; the 61.8 Fibonacci Retracement Fan Support Level is currently passing through this zone. The last time the AUD/JPY reversed a breakout into this support zone, price action accelerated to the upside; more downside could emerge if a new fundamental catalyst emerges and the next long-term support zone is located between 71.732 and 72.155. You can learn more about a support zone here.
AUD/JPY Technical Trading Set-Up - Breakdown Extension Scenario
⦁ Short Entry @ 74.750
⦁ Take Profit @ 73.400
⦁ Stop Loss @ 75.100
⦁ Downside Potential: 135 pips
⦁ Upside Risk: 35 pips
⦁ Risk/Reward Ratio: 3.86
In case of a reversal in the Force Index which will lead to a breakout above its descending resistance level, price action could advance back into its resistance zone and pressure for a breakout. The current fundamental scenario favors an extension of the breakout, but the volatile global economic landscape could provide a short-term catalyst. The next resistance zone awaits the AUD/JPY between 76.063 and 76.273 which should be considered an excellent short-selling opportunity.
AUD/JPY Technical Trading Set-Up - Limited Breakout Scenario
⦁ Long Entry @ 75.350
⦁ Take Profit @ 76.100
⦁ Stop Loss @ 75.000
⦁ Upside Potential: 75 pips
⦁ Downside Risk: 35 pips
⦁ Risk/Reward Ratio: 2.14

