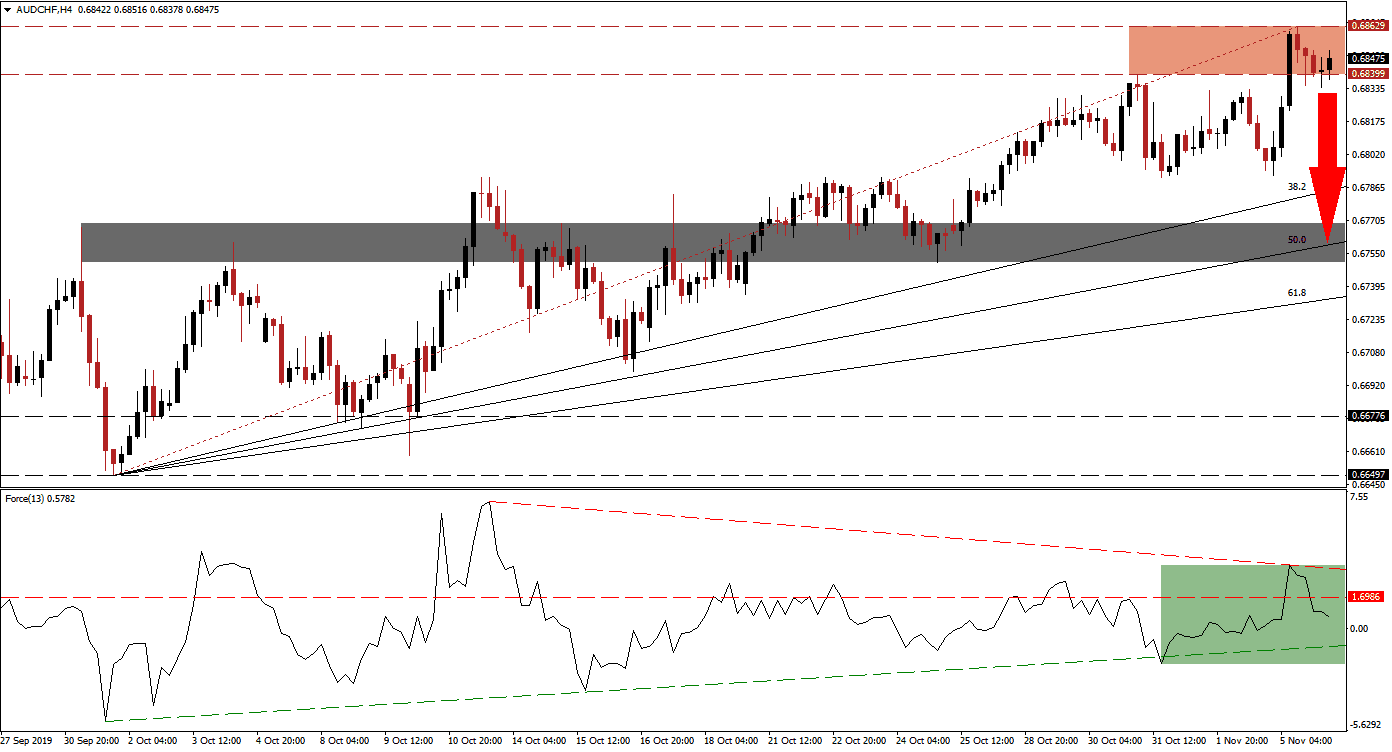
Australian economic data was mixed, Chinese data came in a touch softer and overall global data showed that the economy remains fragile at best. This didn’t stop the risk on mood from pushing the Swiss Franc lower, the safe haven currency performs better during risk-off trading sessions, and the AUD/CHF into its resistance zone. The uptrend now appears exhausted and price action is expected to enter a corrective phase which will close the gap between this currency pair and its Fibonacci Retracement Fan.
The Force Index, a next generation technical indicator, points towards the loss in bullish momentum after price action reached its resistance zone; a reversal followed and a new descending resistance level emerged. The Force Index then pushed below its horizontal support level and turned it into resistance as marked by the green rectangle. This technical indicator is now likely to extend its descend into negative territory which will place bears in charge of the AUD/CHF and may initiate a corrective phase in this currency pair. You can learn more about the Force Index here.
An early warning sign that the longer-term uptrend may be coming to an end was offered from the last reversal in this currency pair after it reached the bottom range of its resistance zone. This failed to result in a higher low, but price action spiked into its resistance zone where bearish momentum is on the rise; the resistance zone is located between 0.68399 and 0.68629 as marked by the red rectangle. Forex traders should monitor the Force Index which is expected to lead the AUD/CHF into a breakdown.
As a result of the advance which originated from its long-term support zone located between 0.66497 and 0.66776, a gap between price action and the Fibonacci Retracement Fan Support. With this currency pair trading below the Fibonacci Retracement Fan trendline, a correction is expected; a profit-taking sell-off is likely to provide part of the downside pressure. The AUD/CHF should be able to correct into its 50.0 Fibonacci Retracement Fan Support Level which is moving though its short-term support zone located between 0.67508 and 0.67691 as marked by the grey rectangle. You can read more about a support zone here.
AUD/CHF Technical Trading Set-Up - Breakdown Scenario
⦁ Short Entry @ 0.68500
⦁ Take Profit @ 0.67600
⦁ Stop Loss @ 0.68700
⦁ Downside Potential: 90 pips
⦁ Upside Risk: 20 pips
⦁ Risk/Reward Ratio: 4.50
In case of a reversal in the Force Index, aided by its ascending support level, which can pressure this technical indicator above its descending resistance level, the AUD/CHF could attempt a breakout above its resistance zone. A new fundamental catalyst would be required in order to sustain such a move. The next resistance zone is located between 0.69333 and 0.69540.
AUD/CHF Technical Trading Set-Up - Limited Breakout Scenario
⦁ Long Entry @ 0.68900
⦁ Take Profit @ 0.69450
⦁ Stop Loss @ 0.68650
⦁ Upside Potential: 55 pips
⦁ Downside Risk: 25 pips
⦁ Risk/Reward Ratio: 2.20

