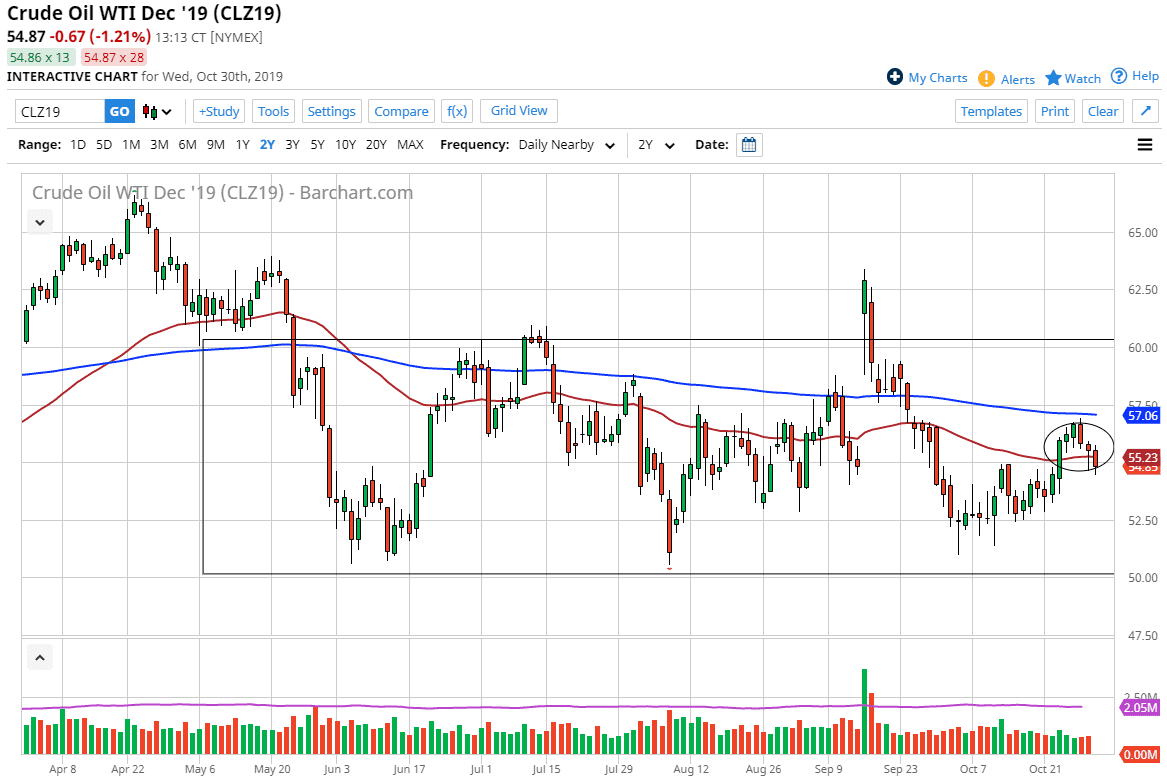
The West Texas Intermediate Crude Oil market has fallen quite a bit during the trading session on Wednesday, heading into the FOMC. However, after the announcement and the press conference, market participants got back to work and have started buying from the lows. The market broke slightly below the hammer of the previous session, but at the end of the day not much has been settled as the recovery has sent the market back above $55.
The $55 level of course is an area that has previously been both support and resistance, so it makes sense that we would continue to see that level offer a bit of a reaction for the markets. Ultimately, the market will find buyers in that area to send the market towards the top of the circle that I have drawn on the chart, closer to the 200 day EMA. With this, I like the idea of buying crude oil but I’m not looking for some type of massive breakout. I believe this is simple consolidation that we will continue to see show itself in this market as OPEC is looking to cut production during the December meeting, but at the same time this is a market that has to deal with the idea of trade wars, and a possible lack of demand.
Looking at the longer-term chart, you can see that the $50 level is marked as the floor and the $60 level is marked as the potential ceiling. We are essentially at “fair value”, so seeing this market act in a very choppy manner makes quite a bit of sense. I think eventually we will find ourselves dancing between the 200 day EMA which is colored in blue and the 50 day EMA which is colored in red. More stagnation and choppiness make sense, especially as we start to head towards the Friday session which of course is the nonfarm payroll day, meaning that a lot of traders will be cautious about putting too much risk into the marketplace going forward. With that in mind, I like the idea of trading a back-and-forth position between the $55 level and the $57 level over the next couple of days. I would not put too much into the market right now but recognize that there is an opportunity for those who can trade from shorter time frames and the like.

