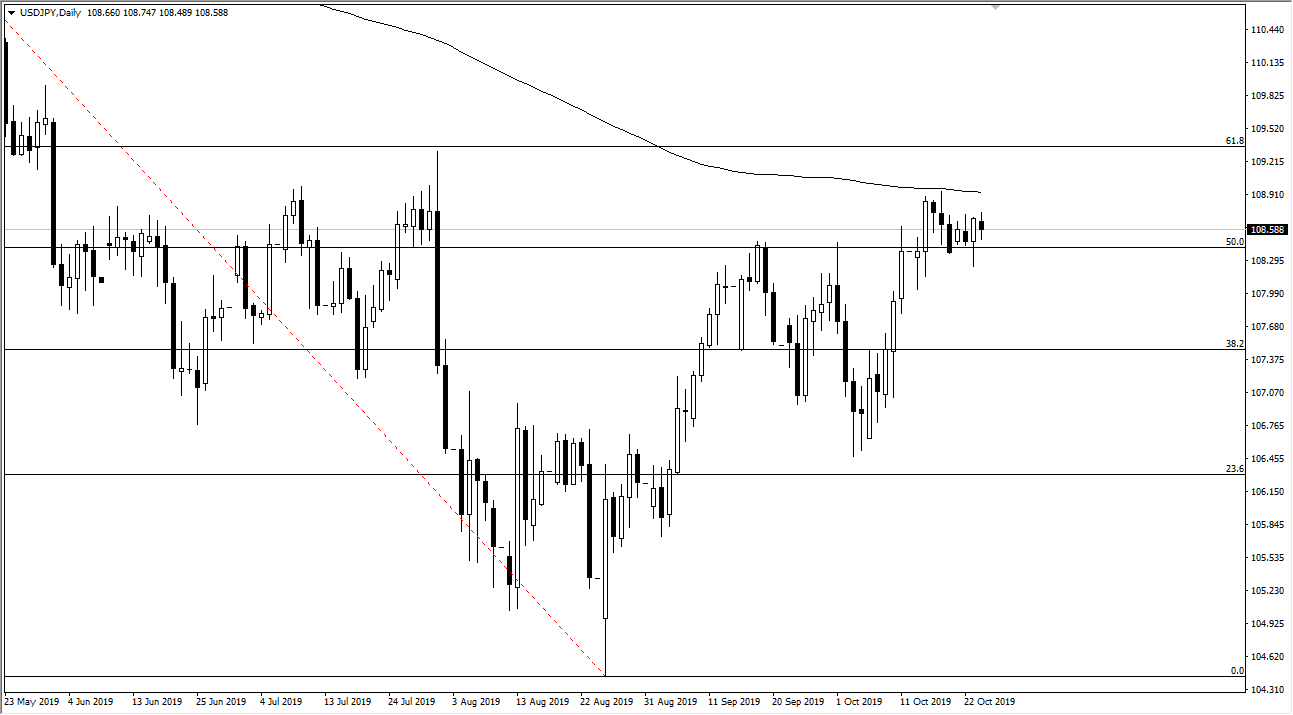
The US dollar went back and forth during the trading session on Thursday, as we continue to grind just below the 200-day EMA against the Japanese yen. Ultimately, this is a market that is trying to decide where it wants to go next, and needless to say the 50% Fibonacci retracement level is going to attract a lot of attention. With that being said, the market is likely to continue to simply wait for some type of direction to be taken. It will probably be some type of external factor that jumps into this market and push off one direction or another. The first thing that I can think of would be the US/China trade relations, but that seems to be going nowhere.
Beyond all that, we also have to worry about the Federal Reserve next week which is likely to cut interest rates. The question now won’t necessarily be whether or not they are going to cut those rates but whether or not they are going to be hawkish or dovish going forward. That could have a major influence on the stock markets, which will have a knock-on effect over here. A break above the recent highs in the stock markets could signal a “risk on” move overall, sending this market higher.
The 200-day EMA above should be resistance in the short term but if we were to get a nice long candle closing above it on the daily chart it could signal that we are going to kick off to the upside from here. If we can break above the 61.8% Fibonacci retracement level, then we probably have much further to go. The alternate scenario is that we break down below the candlestick from the Wednesday session, which should send this market lower, perhaps down to the ¥108 level, and then eventually the ¥107 level. At this point, the market doesn’t really seem as if it has anywhere to go though, so short-term back-and-forth trading is probably as good as this gets in the meantime. With this, the market is very likely to be very noisy, but you need to keep your position size relatively small until there’s some type of impulsive candle to give us a bit of confidence in one direction or the other. Building a larger position over time probably works out the best for most traders.

