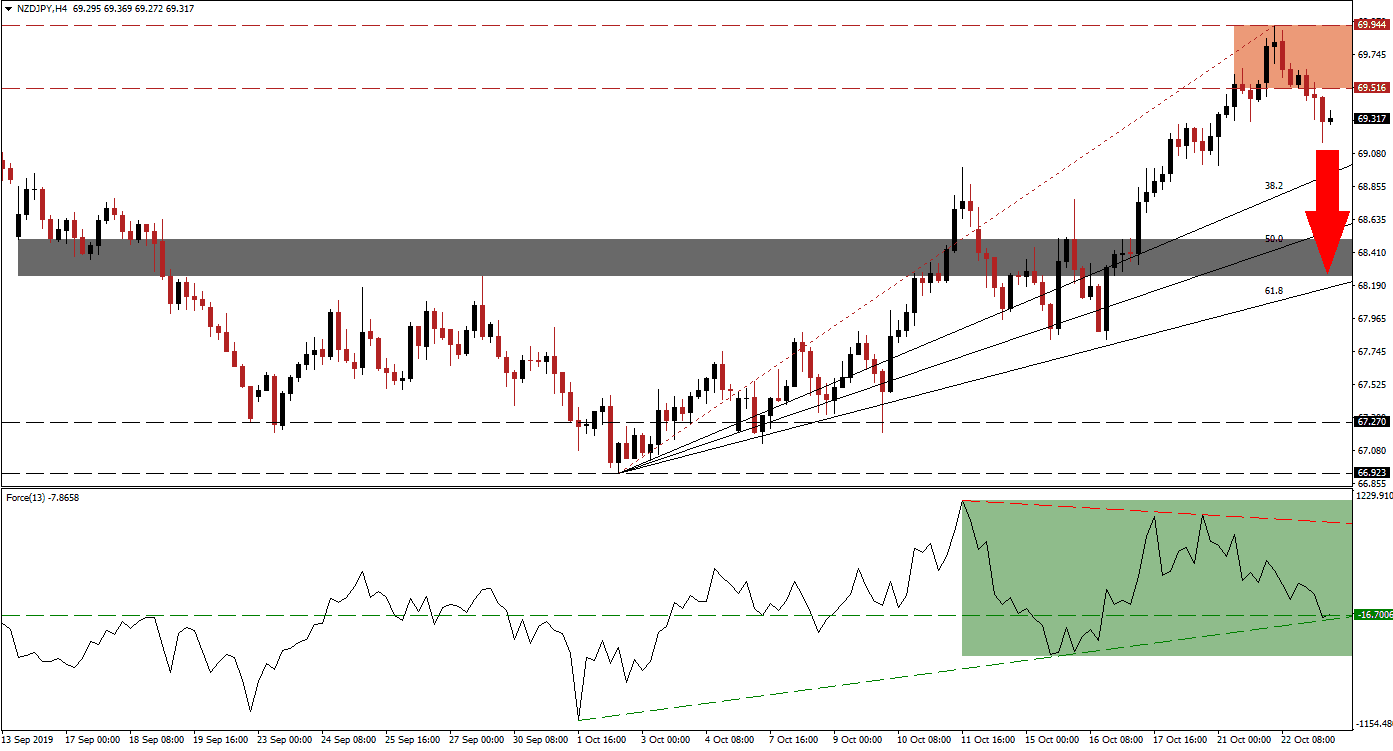
New Zealand reported a slight bigger-than-expected increase in exports for the month of September, but it failed to lift the New Zealand Dollar as a minor risk-off session unfolded during the Asian trading session. This led to a breakdown in the NZD/JPY below its resistance zone and bearish pressures are on the rise. The sharp rally which preceded the breakdown also resulted in a disconnected between price action and the Fibonacci Retracement Fan sequence; the breakdown is expected to close the gap.
The Force Index, a next generation technical indicator, shows the emergence of a negative divergence which represents a bearish trading signal. A negative divergence forms when price action continues to advance while the underlying technical indicator contracts. The Force Index is now trading above-and-below its horizontal support level in negative conditions with its ascending support level soon to cross above it; this is marked by the green rectangle. A sustained breakdown below this twin support level is expected to lead the NZD/JPY further to the downside. You can learn more about the Fibonacci Retracement Fan, the Force Index and the Support Zone here.
Following the breakdown in the NZD/JPY below its resistance zone, which is located between 69.516 and 69.944 as marked by the red rectangle, a short-term corrective phase is likely to follow. The Japanese Yen is receiving a boost due to its safe haven status during risk-off sessions and provides an additional driver to the downside. Forex traders should monitor the intra-day low of 68.997 which marks the previous low before price action pushed into its resistance zone; a push lower by this currency pair is expected to lead to a breakdown below its ascending 38.2 Fibonacci Retracement Fan Support Level.
Given the renewed rise in uncertainty over fundamental events, such as the likely delay in Brexit as well as lack of clarity on the US-China trade truce, is expected to result in more selling pressure in the NZD/JPY. The next short-term support zone is located between 68.249 and 68.499 which is marked by the grey rectangle. This zone is located between the 50.0 and 61.8 Fibonacci Retracement Fan Support Levels; while price action may retrace back into the bottom range of its resistance zone, which will give traders a good short entry opportunity into this trade, this currency pair is expected to challenge its short-term support zone to the downside. You can learn more about a Breakout, a Breakdown and the Resistance Zone here.
NZD/JPY Technical Trading Set-Up - Breakdown Extension Scenario
Short Entry @ 69.350
Take Profit @ 68.250
Stop Loss @ 69.650
Downside Potential: 110 pips
Upside Risk: 30 pips
Risk/Reward Ratio: 3.67
Should the double support level in the Force Index hold and push this technical indicator to the upside, the NZD/JPY could follow suit and attempt a breakout above its resistance zone. The current fundamental picture favors more downside in this currency pair and any short-term breakout should be considered a good longer term short-selling opportunity. The next resistance zone is located between 70.658 and 71.102.
NZD/JPY Technical Trading Set-Up - Limited Breakout Scenario
Long Entry @ 70.100
Take Profit @ 70.900
Stop Loss @ 69.800
Upside Potential: 80 pips
Downside Risk: 30 pips
Risk/Reward Ratio: 2.67

