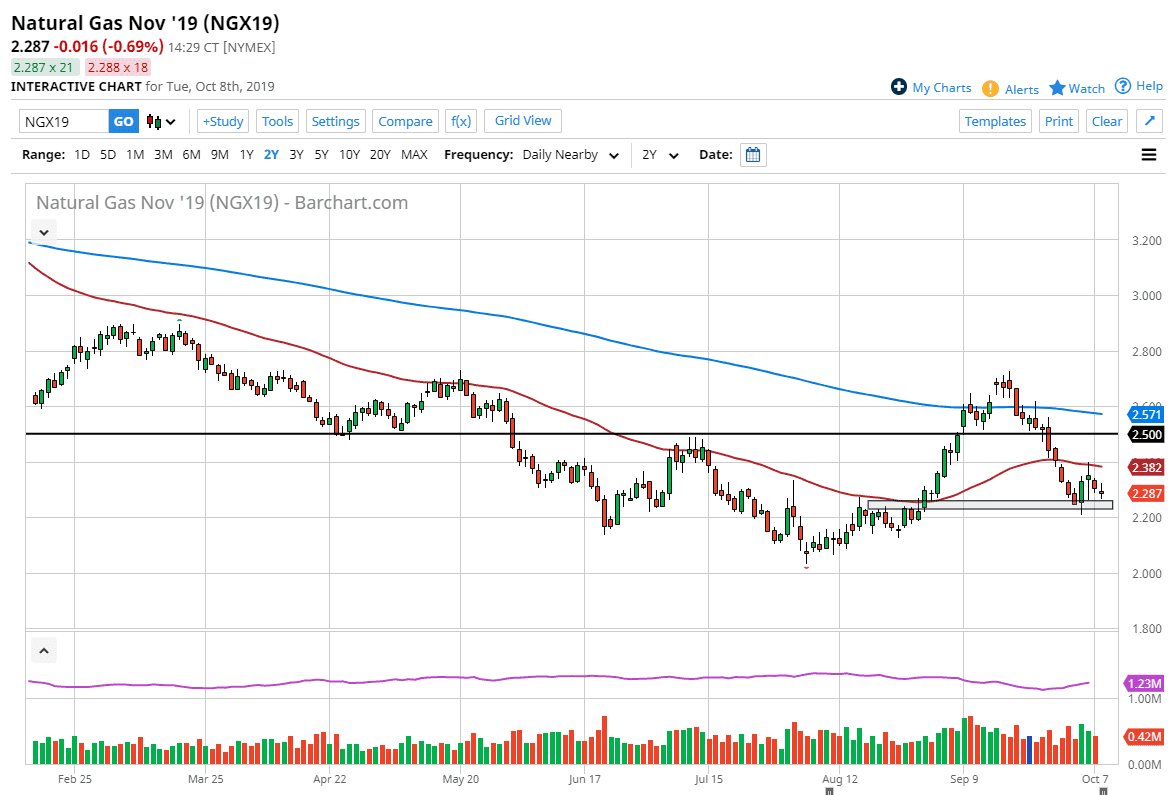
The natural gas markets have gone back and forth during the trading session on Tuesday, as we continue to see a lot of support just above the $2.25 level. Beyond that, there seems to be a significant amount of support at the $2.20 level, as it was the recent resistance level where we had broken above, and now should offer enough “market memory” to offer support. We have bounced from there recently, and then pulled back over the last couple of sessions. One thing that can be pointed out about the Monday and Tuesday sessions is that it is rather choppy and neutral, and this tells me that it’s likely that we are going to continue to see buyers underneath. The top of the range features the 50 day EMA painted in red.
Looking at this chart, I suspect that it’s probably going to be a scenario where we continue to go back and forth and try to build up a certain amount of momentum and viability for a move higher for the winter move. After all, we typically rally during the wintertime and it’s likely that the market will eventually have movement to the upside, as we should go towards the 50 day EMA, and then towards the $2.50 level. After that, the 200 day EMA would come into play, so therefore those are my mile markers that I am paying attention to.
Looking at the chart, we are at extreme lows and I think that the “floor” in the market it is closer to the $2.00 level and therefore I think that if we were to break down below there it would be a structural decline and natural gas that would be unrecoverable. Needless to say, I don’t think that’s happening anytime soon and I think that it’s only a matter of time before pullbacks attract a certain amount of buying pressure. I think that the market will make a fresh, new high, on the way to the month of January where we would then start to see sellers come back into the market in short what is a major market that is over supplied to say the least. In fact, the Americans have 300 years’ worth of natural gas at the very least that they know of in the ground. In other words, natural gas will continue to have issues.

