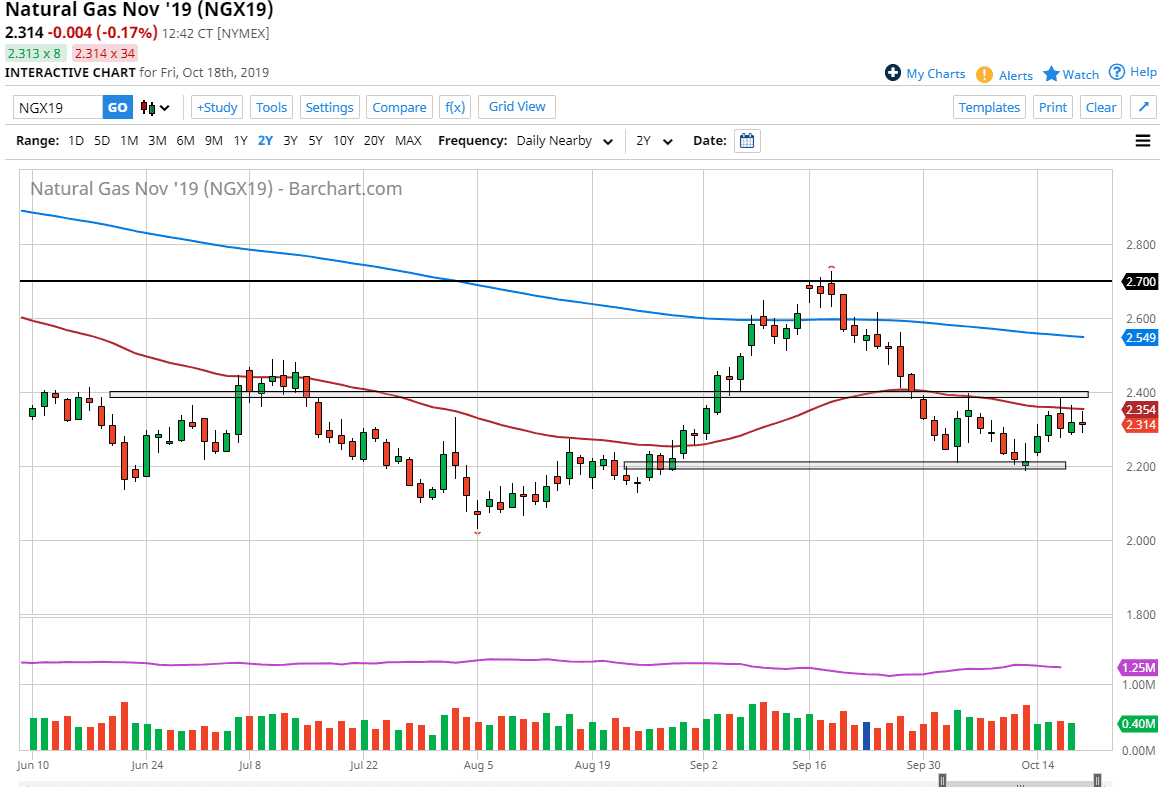
The natural gas markets went back and forth during the trading session on Friday, spurred by both technical and fundamental reasoning. The concerns about a tropical depression in the Gulf of Mexico slowing down refinery capacity is one of the bullish arguments right now, but at the same time we have a lot of technical resistance overhead in the form of the 50 day EMA which is painted in red and of course the $2.40 level which has been resistance a couple of times already.
Underneath, it looks as if the $2.20 level will continue to offer support, as it was where the market has bounced from a couple of times. This looks a lot like a basing pattern to me, as we head into the colder months in North America. Temperatures are starting to drop, although they are not getting drastic yet, the first signs of fall have arrived. Just around the corner, much colder temperatures will be coming and it’s only a matter of time before we get weather reports of extreme cold. That will drive up demand for natural gas which of course will drive the market higher.
At this point it comes down to whatever timeframe you are trying to trade. If you are short-term trader, then you are essentially trading in a $0.20 range. You can look at the $2.40 level as your resistance in the $2.20 level is your support. You could even take it one further and look at the $2.30 as “fair value.” All things been equal though I like to trade with the longer-term trend and it certainly looks as if we are trying to turn that around. A break above the $2.40 level should be rather bullish, because it would not only break above the 50 day EMA and the most resistant pricing recently, but it would also breakthrough a couple of longer tales on candles that showed signs of resistance. At that point I would look for the market to go looking towards the 200 day EMA which is closer to the $2.55 level.
All of that being said, keep in mind that the natural gas markets are relatively thin and can be moved by large players. Because of this, I tend to follow longer-term trends instead of day trading as the noise can be significant in this market. Weather reports aren’t exactly reliable, so quick corrections are also possible.

