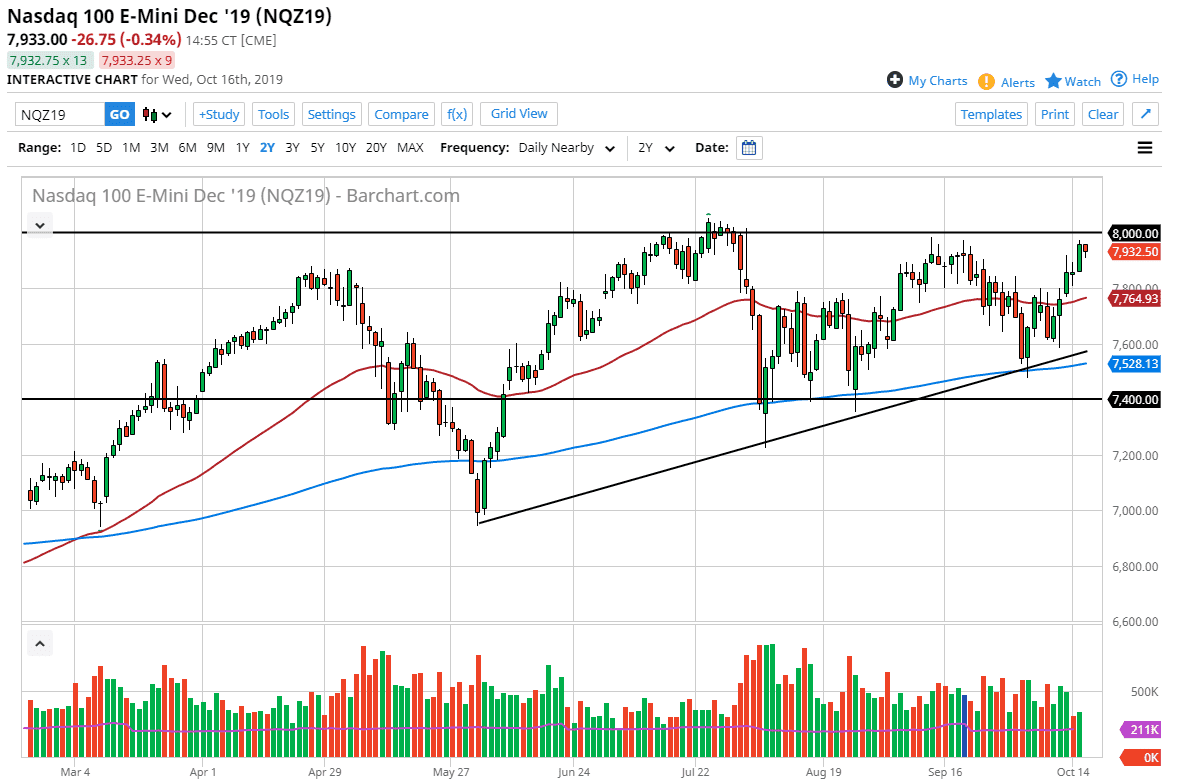
The natural order of things is that we continue to test resistance, and the NASDAQ 100 level has shown this scenario again. The 8000 level is obviously a very massive resistance level, and a large, round, psychologically significant figure that will attract a lot of attention. Ultimately, if we were to break above that level and leave that behind, it would be a very bullish sign. Keep in mind that the market is driven by these larger numbers and quite often, as large order flow tends to appear. So far, the 8000 level has continue to offer a lot of resistance in selling pressure, but the fact that we are approaching it for the third time suggests that we are going to try to break out to the upside eventually.
We are in the middle of earnings season so that of course can have a major influence on where the market goes to the upside. The uptrend line underneath should continue to offer plenty of buying opportunities at dips, and I do think that it’s only a matter time before value hunters come back into this marketplace. The 50 day EMA which is painted in red should offer quite a bit of support, especially near the 7800 level. Below there, the uptrend line at the 7600 level should offer support, just as not only do we have the uptrend line but we also have the 200 day EMA underneath that and of course the most lows.
At this point, I like the idea of picking up value when it appears, as there are plenty of reasons to think that traders will continue to jump into this market, not the least of which is that the Federal Reserve is going to continue to liquefy the markets. That essentially brings the “Tina” situation, meaning there is no alternative. There are no returns when it comes to any type of interest, so that throws money into the stock market by default. If the situation remains the same, I think that traders will continue to come back and pick up dips based upon perceived value. The 7400 level underneath offers the “floor” in the market, so if we were to break down below there then it could be a trend change. Otherwise, I continue to look for short-term bounces to take advantage of going forward as we are in a longer-term uptrend to begin with.

