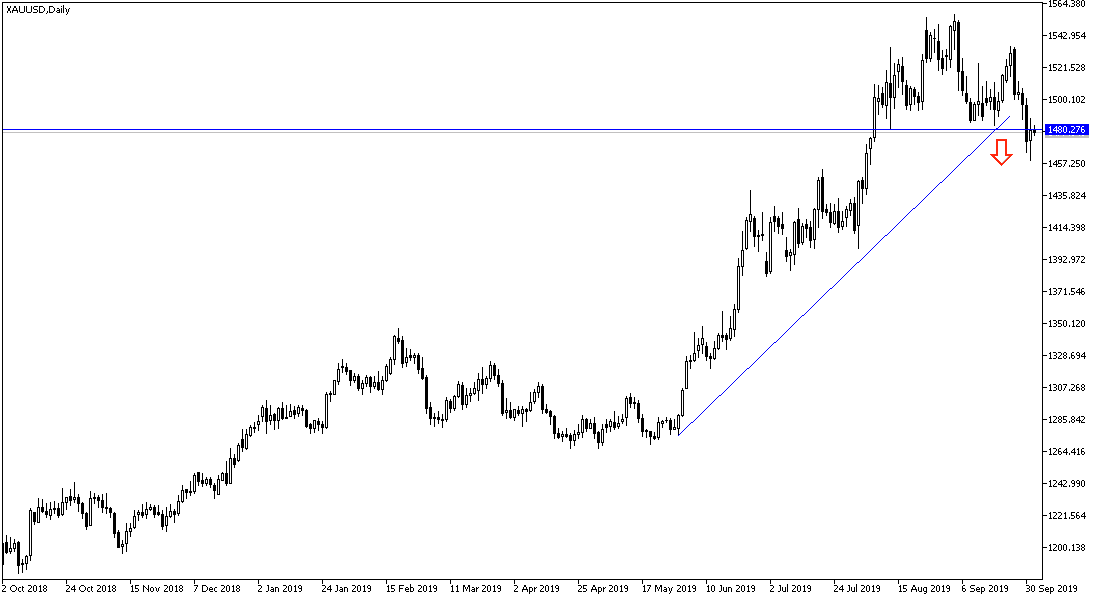
The gold price rebounded from its lowest level in nearly two months during Tuesday's trading session, rising to $1487 an ounce after testing the $1459 support. The US dollar's gains were stalled and investors returned to safe havens again, which gave the yellow metal new impetus. The decline in the US ISM manufacturing index to its lowest level since 2009 led to a decline in the major US stock indices, which increased demand for the precious metal. The data showed the manufacturing index fell to 47.8% last month from 49.1%, its lowest level since June 2009; the time when the Great Depression ended.
Stronger recent gold losses were supported by a stronger US dollar against major currencies, as well as rising US stocks. The US Dollar Index (DXY), which measures the performance of the greenback versus a basket of six rival currencies, hit its highest level since April 2017 on Monday, after gaining 3.4% in the second quarter, marking the strongest quarterly gain since a 5% rise in the second quarter of 2018. The performance of the US dollar and gold will react strongly as their relationship is inverse with the release of US jobs figures for September next Friday.
According to the technical analysis of gold: Gold price moving to the $1460 support established the strength of breaking the uptrend as shown on the daily chart. In recent technical analysis, we have confirmed that support levels below the $1,500 psychological resistance will remain important watch areas for gold investors. The luster of the metal's uptrend may return to stability around the highest psychological resistance of $1,500. Bears may take control of the trend if the price returns to 1460 support again. We still prefer to buy gold from every bearish level.
As for today's economic data: Gold price will react today with the release of the UK Construction PMI, the ADP survey of change in the number of non-agricultural jobs, and any developments to global trade and geopolitical tensions, as gold is a favorite haven for investors in times of uncertainty.

