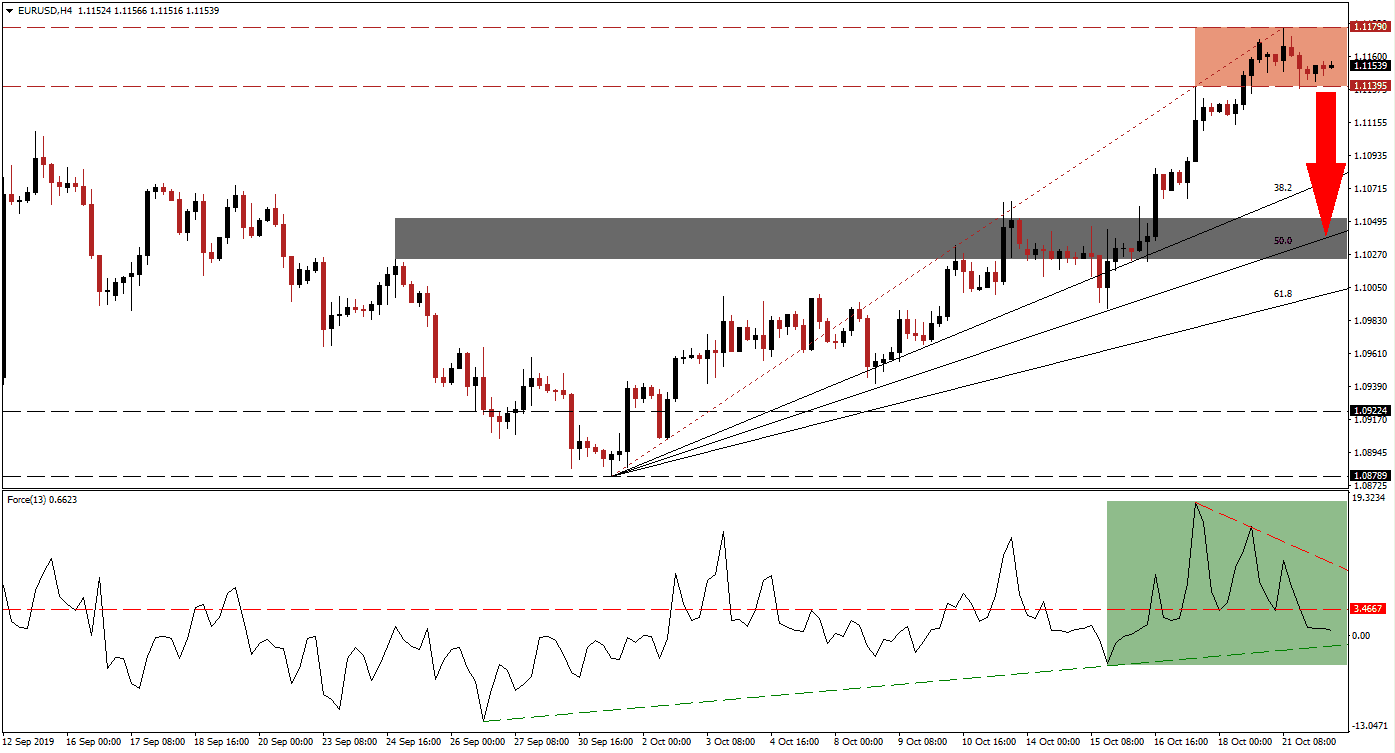
While the overall long-term trend favors more upside in the EUR/USD, a short-term correction is expected to unfold as forex traders realize floating trading profits. Brexit uncertainty has dampened bullish momentum which is now being replaced by a bearish surge inside its resistance zone. With uncertainty over fundamental developments and a technical picture flashing sell signals, price action is expected to complete a breakdown and close the gap to its Fibonacci Retracement Fan sequence which emerged during the spike higher after this currency pair accelerated to the upside from its 50.0 Fibonacci Retracement Fan Support Level.
The Force Index, a next generation technical indicator, shows the formation of a negative divergence which represents a bearish trading signal. A negative divergence appears when an asset advances, but its technical indicator fails to confirm the new highs and contracts. This has additionally resulted in a breakdown by the Force Index below its horizontal support level which turned it into resistance. Its ascending support level is now closing in on this technical indicator as marked by the green rectangle, a breakdown is likely to accelerated the expected sell-off in the EUR/USD. You can learn more about the Fibonacci Retracement Fan, the Force Index and the Support Zone here.
Since price action has started to drift sideways inside its resistance zone, located between 1.11395 and 1.11790 as marked by the red rectangle, bullish momentum is fading and the risk for a breakdown is on the rise. Forex traders should keep an eye out for the intra-day low of 1.11145, the low prior to the most recent push higher; a move below this level following a breakdown in the EUR/USD below its resistance zone is expected to further fuel a short-term correction. Profit-taking is also expected to provide more short-term downside pressure for this currency pair.
A sustained breakdown below its resistance zone should take the EUR/USD into its next short-term support zone which is located between 1.10238 and 1.10514 as marked by the grey rectangle. The 50.0 Fibonacci Retracement Fan Support Level is nestled inside this zone and the last time price action reached its ascending 50.0 Fibonacci Retracement Fan Support Level, a strong move higher unfolded. A correction down to this level will keep the long-term uptrend healthy and intact. You can learn more about a Breakout, a Breakdown and the Resistance Zone here.
EUR/USD Technical Trading Set-Up - Breakdown Scenario
Short Entry @ 1.11550
Take Profit @ 1.10500
Stop Loss @ 1.11850
Downside Potential: 105 pips
Upside Risk: 30 pips
Risk/Reward Ratio: 3.50
In the event of a breakout in the Force Index above its horizontal as well as descending resistance levels, the EUR/USD may attempt to force a breakout of its own and extend its rally. A fresh fundamental catalyst would be required, such as a resolution to Brexit which remains uncertain, in order to maintain the rally without a short-term correction. The next resistance zone is located between 1.12489 and 1.12855 from where a previous sell-off accelerated.
EUR/USD Technical Trading Set-Up - Breakout Scenario
Long Entry @ 1.12050
Take Profit @ 1.12800
Stop Loss @ 1.11750
Upside Potential: 75 pips
Downside Risk: 30 pips
Risk/Reward Ratio: 2.50

