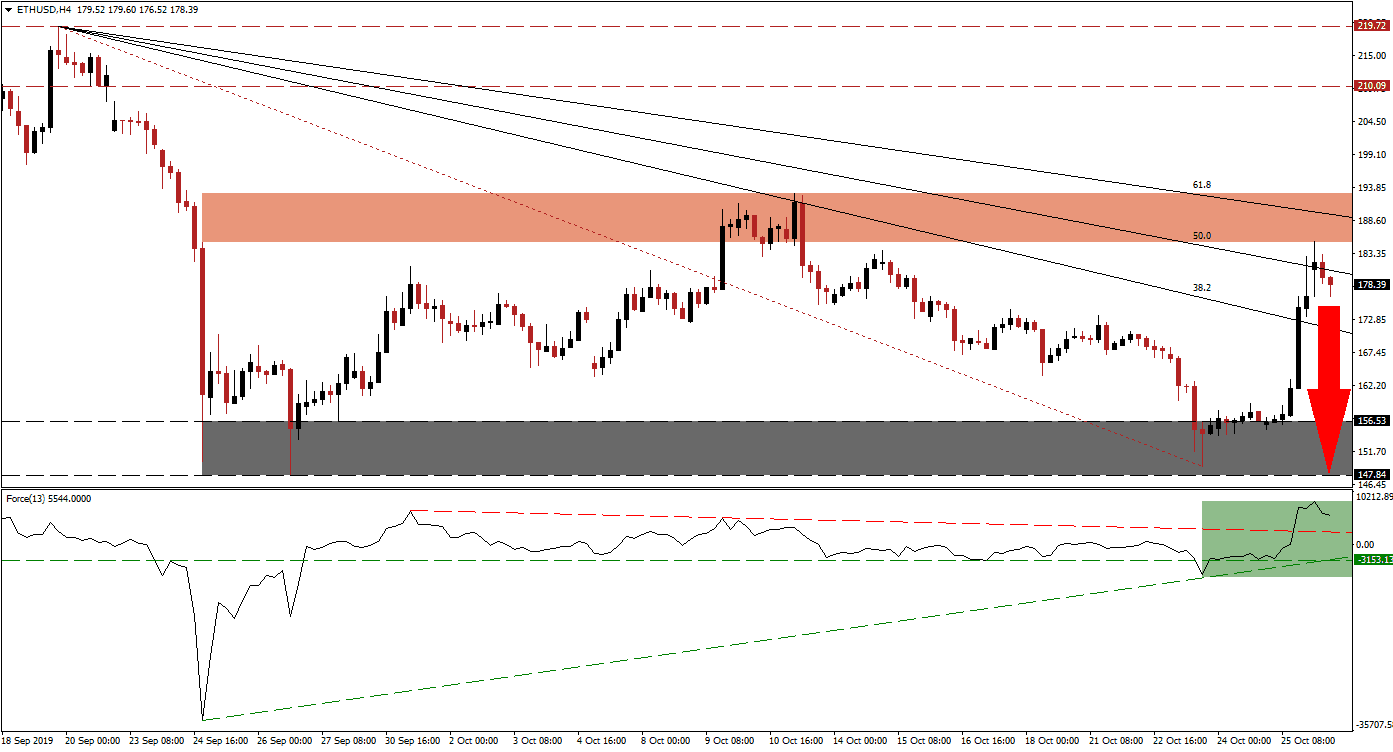
Volatility has always been a part of the cryptocurrency market and it returned last week with a bang. Bitcoin posted its 4th best daily performance with an intra-day surge of over 42% before retreating which inspired most of the sector to advance. The spark was provided by comments from Chinese President Xi in regards to blockchain technology, which many misunderstood as “Buy Bitcoin!” This explains why the strong bullish momentum receded as market participants had the time to digest what President Xi stated and the price spike fizzled out. ETH/USD moved to the bottom range of its short-term resistance zone before reversing direction. You can read more about a resistance zone here.
The Force Index, a next generation technical indicator, confirmed the price spike and accelerated from its ascending support level which led to a breakout above its horizontal as well as descending resistance levels; this is marked by the green rectangle. The ascending support level has crossed above its horizontal support level in a bullish development, but ETH/USD is losing upside momentum. This technical indicator is now expected to collapse into its ascending support level which will lead price action to the downside; such a move would take the Force Index back into negative territory and place bears in control of this cryptocurrency pair.
As ETH/USD pushed through its descending 38.2 Fibonacci Retracement Fan Resistance Level, it accelerated into the bottom range of its next short-term resistance zone which is located between 185.13 and 192.91 as marked by the red rectangle; the 61.8 Fibonacci Retracement Fan Resistance Level is nestled inside this zone and enhances resistance. This resulted in a brief advance above its 50.0 Fibonacci Retracement Fan Resistance Level which has since been reversed in another sign that bullish momentum has weakened. A breakdown in the Force Index below its descending resistance level, which temporarily acts as support, is expected to initiate the next breakdown sequence. You can learn more about the Fibonacci Retracement Fan here.
Should bullish momentum recede further, ETH/USD is likely to fully reverse its price spike and retrace back down into its support zone which is located between 147.84 and 156.53 as marked by the grey rectangle. The most recent advance kept the long-term downtrend of this cryptocurrency pair intact as price action was driven by the collateral impact from the stellar performance in Bitcoin and not based on fresh fundamentals in Ethereum. Since the downtrend remains alive, supported by fundamentals which point to more downside, a lower low as a result of the reversal should be considered; this will lead to a breakdown below its support zone.
ETH/USD Technical Trading Set-Up - Price Action Reversal Scenario
Short Entry @ 178.00
Take Profit @ 148.00
Stop Loss @ 186.00
Downside Potential: 3,000 pips
Upside Risk: 800 pips
Risk/Reward Ratio: 3.75
With volatility elevated across the cryptocurrency market, a fresh price spike cannot be ruled out. Forex traders should monitor ETH/USD if it approaches its descending Fibonacci Retracement Fan Support Level as this may be the only area from where a renewed push higher could form. An unlikely breakout above its short-term resistance zone will clear the path into its next long-term resistance zone which is located between 210.09 and 219.72. Any such move should be taken advantage of as a short selling opportunity as a profit-taking sell-off is expected to follow.
ETH/USD Technical Trading Set-Up - Limited Breakout Scenario
Long Entry @ 195.00
Take Profit @ 215.00
Stop Loss @ 185.00
Upside Potential: 2,000 pips
Downside Risk: 1,000 pips
Risk/Reward Ratio: 2.00

