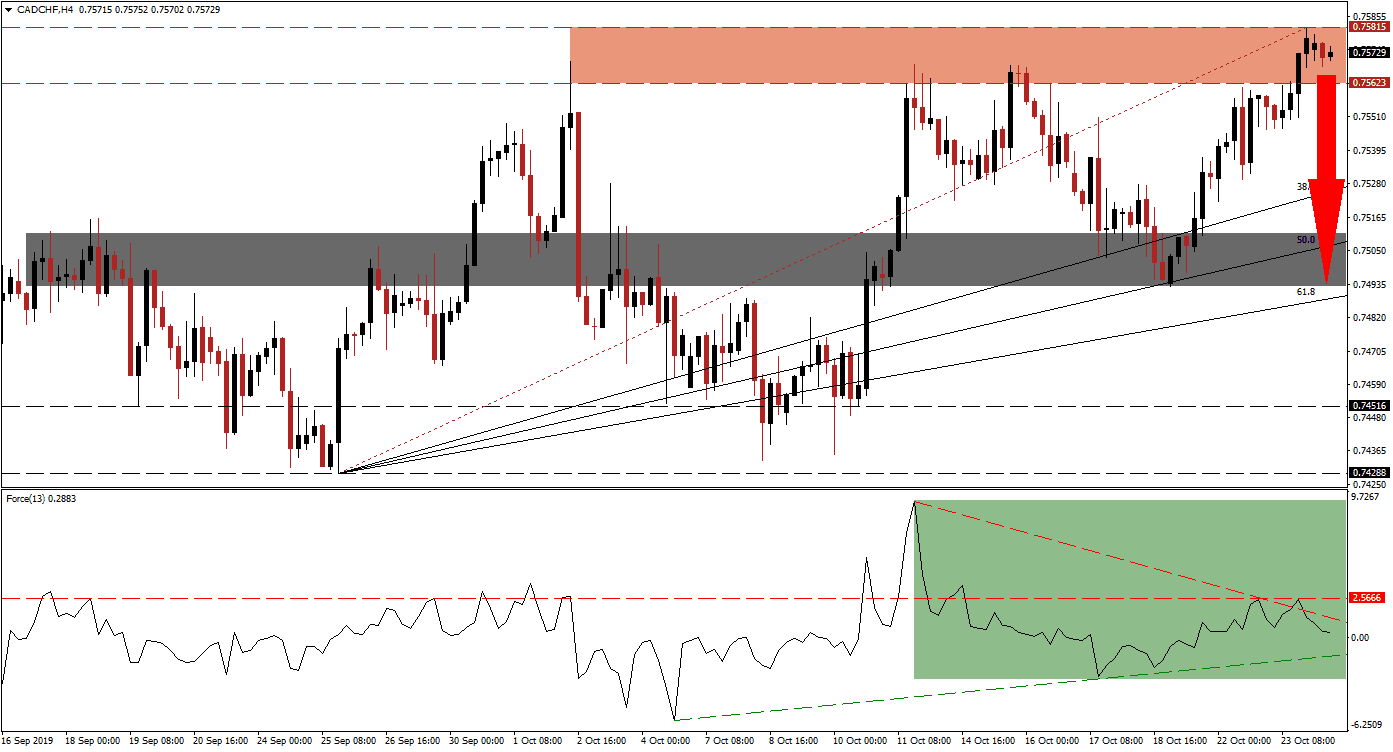
As the aftermath of Monday’s Canadian election results, which left incumbent PM Trudeau with a minority government, the Canadian Dollar remain resilient and the CAD/CHF managed to record a higher high inside of its resistance zone. While this represents a bullish development, the breakdown in the technical scenario suggests that a short-term counter-trend move is building. This is expected to close the gap between price action and its ascending Fibonacci Retracement Fan sequence, which may also break the long-term uptrend in this currency pair.
The Force Index, a next generation technical indicator, is flashing a sell signal as a negative divergence formed. This bearish trading signal occurs when price action pushes higher while the underlying technical indicator moves in the opposite direction. The Force Index remains below its horizontal resistance level as well as below its descending resistance level which suggests that bullish momentum is depleting. While its ascending support level is approaching this technical indicator, as marked by the green rectangle, a move into negative conditions is expected to follow and place bears in charge of the CAD/CHF. You can learn more about the Fibonacci Retracement Fan, the Force Index and the Support Zone here.
With the rise in bearish pressures, the CAD/CHF is expected to complete a breakdown below its resistance zone which is located between 0.75623 and 0.75815 as marked by the red rectangle. This zone has rejected price action on three previous occasions and a fourth rejection is likely. As the global economy appears to be in a much weaker state than what markets have priced in, the Swiss Franc is set to outperform due to its safe-haven status while the Canadian Dollar will face downward pressure from the expected decrease in the price of oil.
Following a breakdown in the CAD/CHF below its resistance zone, price action should be clear to extend a sell-off into its 50.0 Fibonacci Retracement Fan Support Level. This level has previously halted a sell-of which led to the higher high in this currency pair. Additionally, the 50.0 Fibonacci Retracement Fan Support Level is nestled inside the next short-term support zone; this zone is located between 0.74927 and 0.75110 as marked by the grey rectangle. Depending on the magnitude of the anticipated price action reversal, partially fueled by profit taking, a further breakdown cannot be ruled out. You can learn more about a Breakout, a Breakdown and the Resistance Zone here.
CAD/CHF Technical Trading Set-Up - Breakdown Scenario
Short Entry @ 0.75750
Take Profit @ 0.74950
Stop Loss @ 0.75950
Downside Potential: 80 pips
Upside Risk: 20 pips
Risk/Reward Ratio: 4.00
In the event of a double breakout in the Force Index, above its descending and horizontal resistance levels, the CAD/CHF may attempt to follow suit with a breakout above its resistance zone. Upside potential remains rather limited with the next resistance zone located between 0.76126 and 0.76325 from where an extension of a limited breakout is not expected due to the current fundamental conditions, supported by technical factors; any potential advance should be viewed as an excellent opportunity for short positions in this currency pair.
CAD/CHF Technical Trading Set-Up - Limited Breakout Scenario
Long Entry @ 0.76000
Take Profit @ 0.76300
Stop Loss @ 0.75850
Upside Potential: 30 pips
Downside Risk: 15 pips
Risk/Reward Ratio: 2.00

