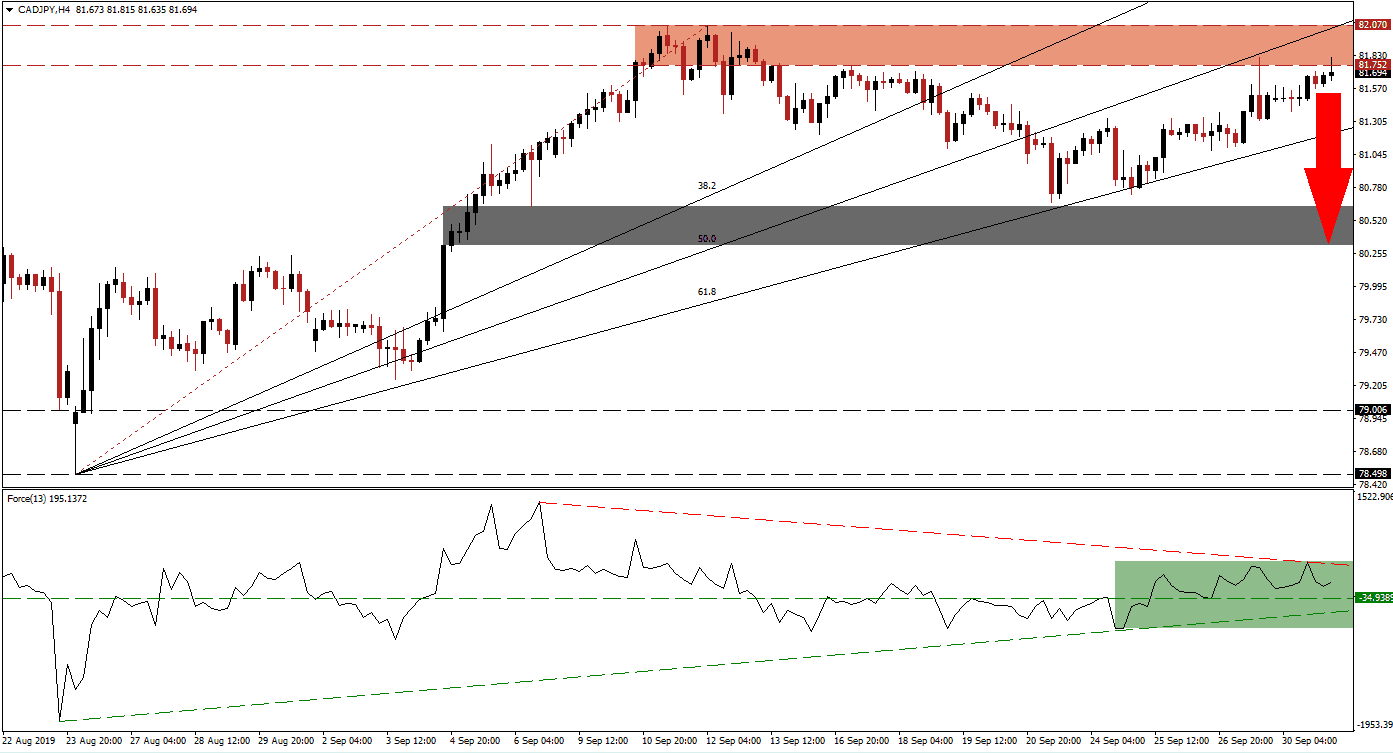
Following a breakdown below its resistance zone, the CAD/JPY descended through its Fibonacci Retracement Fan sequence until it reached its 61.8 Fibonacci Retracement Fan Support Level. Support held and this currency pair advanced, maintaining its position above the 61.8 Fibonacci Retracement Fan Support Level and below is 50.0 Fibonacci Retracement Fan Resistance Level. Price action has now reached the bottom range of its resistance zone from where bearish pressures started to increase as the advance is overextended.
The Force Index, a next generation technical indicator, confirmed the advance as its own ascending support level guided elevated it above its horizontal resistance level which turned it into support. The Force Index struggled as the CAD/JPY reached its resistance zone and a descending resistance level formed, applying additional downside pressure on this technical indicator which currently remains in positive territory. This is marked by the green rectangle in the chart. Failure by the Force Index to advance as price action is testing its resistance zone cold lead to a price action reversal. You can learn more about the Fibonacci Retracement Fan, the Force Index and the Support Zone here.
Economic data out of Japan, in the form of the key Tankan Survey released each quarter, showed a further slowdown in the economy which confirmed that the global economy remains weaker than what is priced into markets. The resistance zone, located between 81.752 and 82.070 which is marked by the red rectangle, is expected to hold firm and force the CAD/JPY into a reversal. While higher oil prices have support the Canadian Dollar, the global economic slowdown will reverse this short-term boost; in addition Canada could face a political change which may pressure the currency lower in the short-term.
Forex traders are advised to monitor the Force Index which is expected to lead a potential price action reversal in the CAD/JPY. The intra-day low of 81.389, which represents the low from a short-term pause prior to the current move into its resistance zone should also be watched as a push below it cold initiate a sell-off. A breakdown below its ascending 61.8 Fibonacci Retracement Fan Support Level should take this currency pair into its next short-term support zone which is located between 80.324 and 80.630 as marked by the grey rectangle. You can learn more about a Breakout, a Breakdown and the Resistance Zone here.
CAD/JPY Technical Trading Set-Up - Price Action Reversal Scenario
- Short Entry @ 81.750
- Take Profit @ 80.450
- Stop Loss @ 82.150
- Downside Potential: 130 pips
- Upside Risk: 40 pips
- Risk/Reward Ratio: 3.25
While the fundamental picture favors a correction in the CAD/JPY, supported by technical aspects, an extension of the rally due to a fundamental catalyst may materialize. This is expected to be a short-term event and should be considered a good long-term selling opportunity. The next short-term resistance zone is located between 82.446 and 82.808, the top range of this zone is where a previous sell-off emerged.
CAD/JPY Technical Trading Set-Up - Limited Breakout Scenario
- Long Entry @ 82.200
- Take Profit @ 82.750
- Stop Loss @ 82.000
- Upside Potential: 55 pips
- Downside Risk: 20 pips
- Risk/Reward Ratio: 2.75

