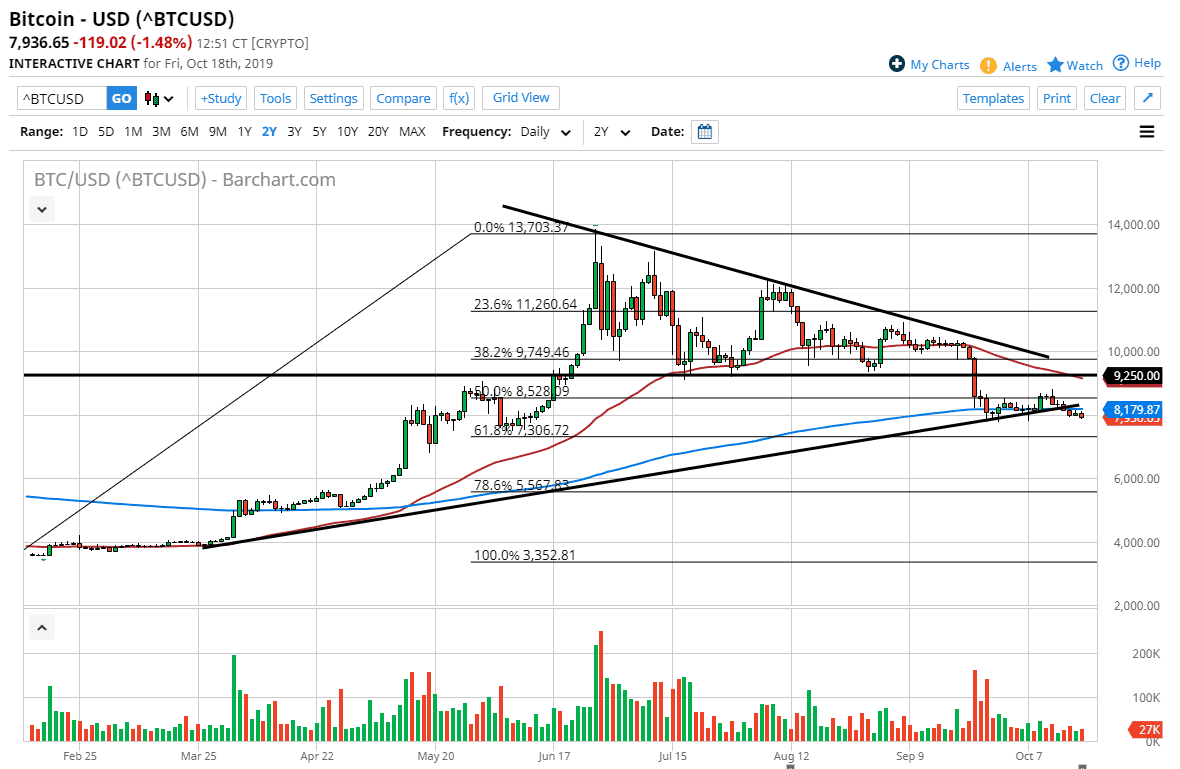
Bitcoin markets initially tried to rally a bit during the day on Friday but continue to see the 200 day EMA bring out sellers. It hasn’t exactly been an explosive range that we have been dealing with, but the markets have decidedly rolled over during the last couple of days, preceded by a significant break down out of the now well-known descending triangle marked on the chart. Because of this, I think it’s a simple consolidation before the continuation play that we have just witnessed. Continuation looks to be underway and based upon the measured move coming out of the descending triangle we are looking at a potential target of roughly $4800.
The 200 day EMA is starting to slope slightly lower, and the 50 day EMA most decidedly is. In other words, it’s only a matter time before we get the so-called “death cross”, which is a longer-term sell signal. I don’t necessarily follow that signal but it does tend to have a bit of a psychological impact on markets.
The previous uptrend line should now offer plenty of resistance, so am a seller if the market touches that area. Beyond that, the market will find resistance at the 50 day EMA and of course the $9250 level which was the bottom of the descending triangle that broke this market down in the first place. What’s even more interesting is that same shape was what brought market crashing lower from highs just about 18 months ago. With that being the case, I think that a certain amount of market memory and skittish behavior will enter the marketplace. Remember, there are a lot of traders that buy Bitcoin all the way back at $17,000 and are essentially praying that it comes back. About the time you hear how great bitcoin is in the mainstream media, that’s the time to start selling. This time has been no different.
There was a large flow of capital out of China recently, and that was part of what’s it bitcoin higher. Now that seems to be abating, and that of course is one less reason to be bullish. Beyond that, with central banks around the world looking to cut interest rates and do quantitative easing, by all means bitcoin should be rallying. However, it is not and that speaks more volume to me than anything that I can see on this chart. The market is indeed very soft looking.

