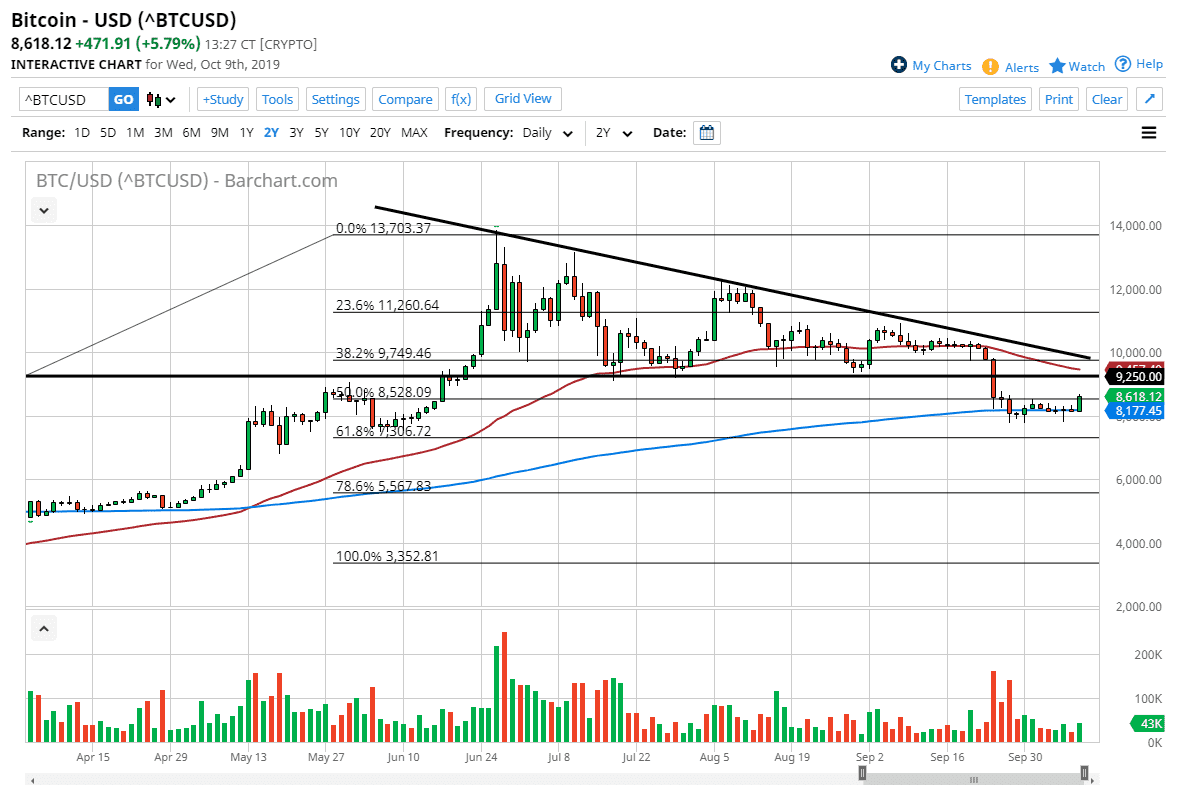
Bitcoin markets rallied during the trading session on Wednesday, launching from the 200 day EMA and even managed to break above the $8500 level. This is based upon chatter that institutional interest in Bitcoin has doubled, but that should not be much of a surprise. When you look at the charts, you can make a significant argument for the move happening anyway, so this may simply be the excuse they needed.
To the upside I see the $9250 level as offering a significant amount of resistance based upon the fact that it was the previous support level on the descending triangle, and of course the 50 day EMA is starting to come into that region as well. The 50 day EMA is rather important in the Bitcoin markets specifically, as it seems to be paid quite a bit of attention to. Remember, this is a very thin market so institutional orders can certainly have a major influence one way or the other.
The size of the candle stick is somewhat impressive, and we gained 5% during the day. That’s obviously a good sign, but when looked at through the prism of the last several months, it’s but a blip on the radar. The fact that the 200 day EMA has held is probably the one major bullish signal on the chart, so that is something to hang your hat on if you are a longer-term holder. Beyond that though, we would need to clear not only the $9250 level, but the 50 day EMA level and perhaps even the downtrend line from the previous triangle to have wiped out all of the selling pressure. In other words, the market would need to be back above the $10,000 level for any type of confirmation.
For what it’s worth, later in the day we are starting to see a little bit of a pushback against the rally, and I anticipate that as soon as we see some type of exhaustive candle on a higher timeframe such as the four hour chart or the daily chart, sellers will come back in and continue to push Bitcoin lower. Lack of adoption continues to plague the market, and a lot of the “hot money” has left this market quite some time ago. Even if it does rally, the days of 20% gains are over.

